

Evaluation of low energy X-ray depth dose distribution by gafchromic film for dosimetry in food irradiation
- Thu Dau Mot University, Binh Duong, Vietnam
- Dalat University, Lam Dong, Vietnam
Abstract
Introduction: Dosimetry is of crucial importance in radiation processing of food. Among others, plastic film has been widely used for dosimetry in radiation therapy since its density is quite similar to the equivalent biological materials. In this study, the depth dose distribution was estimated by using gafchromic film for the purpose of dosimetry in food irradiation.
Experimental: The HD-V2 gafchromic dosimetry film was employed to measure the interested dose instead of ion chamber. A stack of 19 PMMA (polymethyl methacrylate) sheets interleaved with 20 pieces of gafchromic film was made. The phantom was applied in the low energy X-ray beams (maximum 100 keV) to obtain the depth dose profile.
Results: A significant correlation between absorbed doses (D) and color level or optical density (O.D.) of irradiated dosimetry films was observed. The fitting function has the form of , where a, b, c are the parameters to be fitted. The depth dose distribution in the 30 mm thickness phantom was inferred from the calibration.
Conclusion: The present method and the depth dose profile to be obtained are very meaningful in the processing of foodstuffs by radiation.
INTRODUCTION
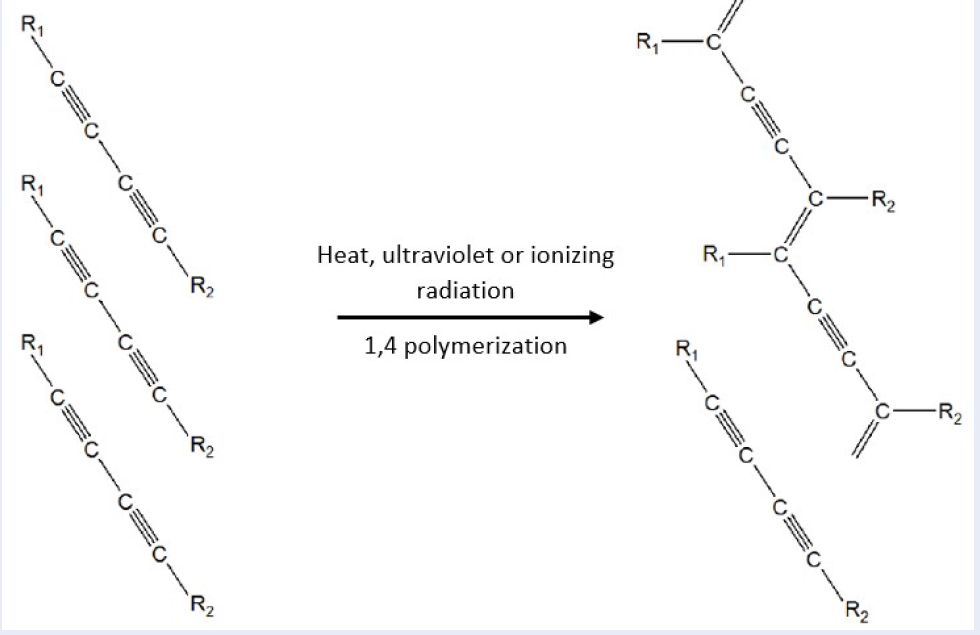
Radiation processing of food requires the determination of dose distribution in the product package. However, experimental measurement of dose profile is usually difficult because of the complicated geometry of agricultural products. Among others, radiochromic dosimetry film can be an adapted device, owing to advantages such as being thin, uniform, and flexible, as well as having radiation absorption characteristics corresponding to agricultural products. Such dosimetry film is a solid-state detector which detects the structural properties of crystalline solids as they undergo a change when exposed to radiation. The materials in the dosimetry film responsible for the coloration are known as crystalline polyacetylenes, in particular diacetylenes1. The diacetylene monomers upon heating, ultraviolet or ionizing radiation exposure undergo progressive 1,4-polymerization, leading to the production of colored polymer chains proportional with the level of exposure, as shown in Figure 1.
Radiochromic dosimetry film has been manipulated in many experiments to evaluate depth dose distribution in various materials, such as phosphate glasses2, aluminum3, and bulk biological samples4. In particular, K. Mehta .5, in 1996, intensively determined the depth dose distributions in polymethyl methacrylate (PMMA) and polyethylene (PE) for a 10 MeV electron beam under typical radiation processing conditions using radiochromic films. In 2017, T. Ishizaka .6 developed a method to measure the ion beam relative intensity distribution using gamma-ray irradiation response function of gafchromic film HD-V2. The radiochromic film showed good performance with excellent sensitivity to ionizing radiation and without need of chemical or physical processing after irradiation.
So far, low energy X-rays is advantageous for the treatment of thin specimens. Furthermore, the shielding is simple, safe, and utilizes low voltage. In Vietnam, very limited studies have been conducted on material science research or food irradiation using low energy X-ray beam. At the Faculty of Physics and Nuclear Engineering, Dalat University, an X-ray irradiator MBR-1618R-BE (Hitachi Power Solutions, Japan)7 has been imported and applied; it is being used extensively for various purposes, such as food irradiation, material testing, and education. The aim of this study is to establish baseline information for the future range of food processing and dosimetry involved.

The diacetylene monomers undergo a 1,4 polymerization upon exposure to heat, ultraviolet or ionizing radiation
METHOD
The main instrumentations used include the following:
1. The X-ray irradiator MBR-1618R-BE (Hitachi Power Solutions, Japan) generates continuous X-rays with the maximum power of 3 kW. The dose rate at 250 mm from the focal spot was estimated at 9.5 Gy/min by Fricke dosimeter. Note that the Fricke dosimeter was used as a benchmark for dose estimation in this work.
2. HD-V2 Gafchromic dosimetry film is a solid-state detector used for the measurement of absorbed dose of high-energy photons with the dose range of 10-1000 Gy. It has near tissue equivalence and has asymmetric structure. An active layer (12 μm) is coated on a polyester substrate (97 μm), which can reduce ultraviolet sensitivity and acts as an anti-oxidizing layer8.
3. The PMMA is an ester of methacrylic acid (CH=C[CH]COH), which has high levels of visible and ultraviolet light transmission, near tissue equivalence9. With regard to radiation interaction properties, most foods behave as water. It is simulated by the PMMA phantom in the present work.
4. The commercial KONICA-195 color scanner provides 8-bit images and is combined with the Color-Pic software to measure the red, green and blue color components of scanned images with 8-bits per channel.
Figure 2a illustrates the fabricated phantom for the determination of the depth dose distribution profile. To measure the absorbed dose inside the PMMA phantom volume, the original HD-V2 film (20 x 30 cm) was cut into small pieces without losing their characteristics, and to fit the default size of the PMMA sheet (10 x 30 x 1.471 mm). As a result, dosimetry film pieces which have 10 x 30 x 0.109 mm in shape were obtained. Each piece was carefully inserted one-by-one between every two PMMA sheets. Consequently, the phantom was constituted by a stack of 19 PMMA sheets interleaved with 20 pieces of dosimetry film. Intentionally, the phantom had a thickness of 30.02 mm, corresponding to the thickness of commercial agricultural products. As shown in Figure 2b, the PMMA phantom was then irradiated perpendicular to the X-ray beam direction with the maximum accumulated dose of 150 Gy. The distance between the focal spot and the detection area was 250 mm. The operating voltage and current of X-rays tube were set to 100 kV and 30mA, respectively. Note that the light inside the chamber was turned off during irradiation to avoid the unexpected polymerization on the irradiated films, which can lead to incorrect results.
After irradiation, the dosimetry films were withdrawn from the irradiation chamber and rested for about 1 day in dark room condition. Due to the post-irradiation polymerization which tends to vary most remarkably within 24 hours after irradiation10, the samples were measured after at least such amount of time from the end of the experiment to avoid such effect. The color measurement process was carried out by a common technique in which the combination of a scanner and a color reading software was employed. All the irradiated film was transferred to the KONICA-195 color scanner, and then the 8-bit images were produced corresponding to the scanned dosimetry films. The scanner was kept in consistent operating condition, including warm-up, uniformity and resolution. Finally, the exposure level of the irradiated film was analyzed using the Color-Pic software. All the images were converted into color-scale images and their color values were taken as references corresponding to the exposure levels.
For the wide range dosimetry in lateral, the exposure was carried out for the establishment of the calibration curve in advance. Initially, 3 sets of dosimetry film with 5 optional-sized pieces of each were prepared. Based on this, the irradiation was performed 3 times under the same condition. The data presented in this work are mean values; the uncertainties are also shown. The dosimetry films were given an exposure rate of about 9.5 Gy/min at 100 kV, and the increments were 3 minutes apart (3, 6, 9, 12, and 15 minutes). Likewise, in order to evaluate the depth dose profile in the PMMA phantom, another 3 sets of dosimetry film were prepared for irradiation (3 times) under the same conditions. Each includes 20 pieces with the size of 10 x 30 x 0.109 mm, as mentioned above.
The experiment was conducted under consistent room conditions to eliminate the turbulence of factors, such as temperature, pressure, ultraviolet and humidity10.

Experimental setup for low energy X-rays depth dose measurement in PMMA phantom. (a) PMMA phantom constituted from a stack of 19 PMMA sheets (10 x 30 x 1.471 mm) interleaved with 20 pieces of dosimetry film (10 x 30 x 0.109 mm). The phantom was achieved with the uniformity as much as possible, in which the gap between dosimetry film and PMMA sheet was tightly contacted; (b) Fabricated PMMA phantom was subjected to the X-rays beam inside the irradiation chamber, the operating voltage and current were set at 100 keV and 30 mA, corresponding to the X-rays beam energy within 100 keV.
RESULTS
Scanned images of dosimetry films at various doses are shown in Figure 3. The figure indicates the relationship between two parameters, including exposure and color level. This is due to the performance of the gafchromic film characteristics. As can be seen from the figure, the color of the dosimetry films changed with regard to the irradiation dose. The more exposure the dosimetry film had to face, the darker the color. The color parameter was quantified by using the Color-Pic software. The red, green and blue color components were read from the scanned image of the dosimetry film, as shown in Figure 4. For every measurement, the region of interest is at the center part of the image. Detection was made around the center region of the image by 5-point cluster and the value which has highest appearance frequency was picked up.
The optical densities of the dosimetry films were calculated by equation (1), in which the amount of dose delivered to the film (D) corresponds to the change of optical density (O.D.) in the films 11. Thereby, the fitting functions were established based on the series of these two parameters, which are shown in
where is bit numbers per channel and is the color value.

Color change of dosimetry films at different dose.

The color value read out by the Color-Pic software.
The color values and optical densities of measured dosimetry films
| Irradiation time | Accumulated | Color value | Optical density | ||||
| ( minutes) | dose (Gy) | Red | Green | Blue | Red | Green | Blue |
| 0 | 0.0 | 135 ± 2 | 157 ± 2 | 33 ± 1 | 0.276 ± 0.006 | 0.211 ± 0.005 | 0.888 ± 0.013 |
| 3 | 28.5 | 8 ± 1 | 32 ± 1 | 18 ± 1 | 1.504 ± 0.051 | 0.901 ± 0.013 | 1.151 ± 0.023 |
| 6 | 58.2 | 2 ± 1 | 15 ± 1 | 11 ± 1 | 2.106 ± 0.176 | 1.230 ± 0.028 | 1.365 ± 0.038 |
| 9 | 87.9 | 1 ± 1 | 7 ± 1 | 8 ± 1 | 2.407 ± 0.301 | 1.561 ± 0.058 | 1.504 ± 0.051 |
| 12 | 117.6 | 1 ± 1 | 4 ± 1 | 7 ± 1 | 2.407 ± 0.301 | 1.805 ± 0.097 | 1.561 ± 0.058 |
| 15 | 147.3 | 0 ± 1 | 2 ± 1 | 5 ± 1 | * | 2.106 ± 0.176 | 1.708 ± 0.079 |
Depth dose distribution in PMMA phantom measured by dosimetry film
| Thickness (mm) | Dose rate (Gy/min) | Uncertainty (%) | Thickness (mm) | Dose rate (Gy/min) | Uncertainty (%) |
| 0.00 | 12.33 | 4.45 | 15.80 | 0.95 | 4.83 |
| 1.58 | 6.23 | 1.22 | 17.38 | 0.84 | 3.06 |
| 3.16 | 4.19 | 1.23 | 18.96 | 0.69 | 3.60 |
| 4.74 | 2.88 | 1.37 | 20.54 | 0.61 | 4.03 |
| 6.32 | 2.14 | 2.76 | 22.12 | 0.51 | 8.13 |
| 7.90 | 1.89 | 1.71 | 23.70 | 0.54 | 4.47 |
| 9.48 | 1.65 | 1.86 | 25.28 | 0.40 | 5.83 |
| 11.06 | 1.36 | 2.12 | 26.86 | 0.28 | 8.10 |
| 12.64 | 1.17 | 4.77 | 28.44 | 0.20 | 11.02 |
| 14.22 | 1.06 | 2.57 | 30.02 | 0.24 | 9.33 |

Logarithm scale of depth dose distribution in PMMA phantom.
DISCUSSION
The interaction of radiation with the film produces a polymerization process in the sensitive monomers. This microscopic phenomenon is reflected at the macroscopic level and is related to the radiation dose. The relationship between the physical quantity that represents the darkening of the film and the dose of a set of films exposed to known doses is the calibration. In this present work, the color level and net optical density (O.D.) are represented for the film darkness. Indeed, the color behavior of irradiated dosimetry film can be visibly observed in Figure 3. The results in
Red:
Green:
Blue:
The best fit to the experimental data was taken as the calibration for the future range of dosimetry, which is the green channel in this case. Based on that, the depth dose profile in the PMMA phantom was calculated and shown in
The depth dose profile in the PMMA phantom is shown in Figure 5, and expressed in logarithm scale. As seen in the figure, the absorbed dose was almost attenuated within 30 mm thickness of the phantom. At 1.58 mm depth near the surface, the highest attenuation is observed; here, approximately 50% of the total attenuation was generated. After that, remarkable attenuation was continued; the absorbed dose rate was as low as 1.89 Gy/min at the depth of 7.9 mm. The lower energy photons were quickly absorbed near the surface of the phantom, leading to a significant decrease in dose rate at this shallow region. From about 8 mm depth, the continuous attenuation occurred but in a gradual way. Meanwhile, only the higher energy photons of the X-ray beams could reach the deep side of the phantom volume. Weaker ionizations on the films were observed here; the absorbed dose rate gradually decreased until the depth of 22 mm, to 0.51 Gy/min. Afterwards, there was some fluctuation of absorbed dose rate until the deepest region of the phantom was reached. It is likely that unexpected effects, such as accumulated charge in the material, might occur since the presence of air between each pair of sheets was ionized during the irradiation and can, therefore, act as a conductor, leading to an increase of dose 12.
Indeed, it is difficult to accurately estimate the depth dose by attenuation law calculation because: (a) the X-ray beam has various energy photons, and (b) from scattering and secondary radiation dose (which are hard to be estimate by simple calculation). The data in our study can be used for the process of food irradiation when absorbed doses for exposed samples are desired.
CONCLUSIONS
The experimental evaluation of depth dose profile by low energy X-rays was reflected in this work. Instead of ionization chambers, HD-V2 Gafchromic dosimetry film (solid state detector) was used preferably to measure the depth dose in the PMMA phantom. In conclusion, this work demonstrates dose mapping of food irradiation process through the measurement of dose distribution in representative product arrangements. On the other hand, the methodology may contribute to the dosimetry and control methods for other processing applications.
However, this measurement was carried out at the narrow center area of the irradiation beam. Appropriate depth doses of different irradiation angles and diameters need to be investigated for further broad use. To confirm the reliability of the method, further studies are warranted, such as ones which investigate the simulation of low energy X-ray beam depth dose for comparison.
COMPETING INTERESTS
The authors declare that they have no competing interests.
ACKNOWLEDGMENTS
This work was funded by Thu Dau Mot University, and partly by the Department of Quantum and Radiation Engineering – Osaka Prefecture University. The authors also wish to thank the Faculty of Physics and Nuclear Engineering – Dalat University, for the operation of X-rays irradiator MBR-1618R-BE (Hitachi Power Solutions, Japan).
AUTHOR CONTRIBUTIONS
Huy Le Viet proposed the experimental plan, implemented the experiment, analyzed the data and wrote the manuscript. Ngoc Hoang Van supported the experiment and analyzed the data. Prof. Kume Tamikazu and Asso. Prof. Son Nguyen An gave the valuable advices for this work.