

Surface features of polymer electrolyte membranes for fuel cell applications: An approach using S2p XPS analysis
- Faculty of Materials Science and Technology, University of Science, 227 Nguyen Van Cu, District 5, Ho Chi Minh 700000, Viet Nam
- Viet Nam National University, Ho Chi Minh City, Viet Nam
- Physics Laboratory, Le Thanh Ton high school, 124, 17 street, District 7, Ho Chi Minh 700000, Viet Nam
- Faculty of Physics and Engineering Physics, University of Science, 227 Nguyen Van Cu, District 5, Ho Chi Minh 700000, Viet Nam
- Biotechnology Center of Ho Chi Minh City, 2374 Highway 1, District 12, Ho Chi Minh 700000, Viet Nam
- Applied Physical Chemistry Laboratory, Department of Physical Chemistry, University of Science, 227 Nguyen Van Cu, District 5, Ho Chi Minh 700000, Viet Nam
- Center for Nuclear Techniques, Viet Nam Atomic Energy Institute, 217 Nguyen Trai, District 1, Ho Chi Minh 700000, Viet Nam
Abstract
Introduction: Hydrogen fuel cell is a promising renewable energy technology. Proton exchange membranes (PEMs) are an essential component of the fuel cell. Although the top surface nature of PEMs directly relates to the durability and efficiency of PEM fuel cells (PEMFC), there has been very limited attention on the chemical compositions and their distribution at the membrane surface. Thus, this study reports the surface characterization of poly(styrene sulfonic acid) (PSSA)-grafted poly(ethylene-co-tetrafluoroethylene) polymer electrolyte membranes (ETFE-PEMs) for fuel cell applications using S2p X-ray photoelectron spectroscopic (XPS) analysis.
Methods: The ETFE-PEMs were prepared by radiation-induced grafting and subsequent sulfonation. The surface features of ETFE-PEMs with grafting degrees (GDs) of 55-101% were characterized using the survey-wide and narrow scans of S2p XPS.
Results: The surface concentration of sulfur slightly decreased with increasing GDs. This interesting result has not been reported in the other graft-type PEMs. The four-component model of narrow scan deconvolution exhibited more reasonable results than the two-component model, in which the sulfonic acid groups (SO-3) slightly increased with increasing GD , not as the case observed by wide scan spectra due to the presence of by-products.
Conclusion: The PSSA grafts were mainly generated inside the bulk rather than at the surface possibly due to the morphological changes. Moreover, the less presence of SO-3 group on the membrane surface despite the large GD values (GD = 55-101%) suggests the advanced electrolyte properties and interfacial stability for fuel cell applications.
INTRODUCTION
Polymer electrolyte membrane fuel cell (PEMFCs) have been considered one of the most promising and competitive energy-conversion sectors because of their high efficiency, operation at relatively low temperatures, short start-up process, and transient-response times compared to other fuel cell types1, 2. The most important part of PEMFCs is polymer electrolyte membrane (PEM), which performs the proton transportation from anode to cathode and separator to H and O permeation through the PEM. Nowadays, PEMFCs have been widely used in transportation, stationary, and portable applications3. Especially, it has been mainly utilized in commercial electric vehicles such as Nexo 2019 (Huyndai), Mirai 2020 (Toyota), Clarity 2020 (Honda), etc.4. However, the main challenge in their development is stability.
Critically, the membrane-electrode assemblies (MEAs) in the fuel cell system have been found to degrade after only a few hundred hours at operating temperatures of 60–70 °C5. Recently, Schulze et al.6 reported the surface decomposition induced the performance loss after 1000 h of fuel cell operation. Therefore, current understanding has suggested that the changes in the PEM surface features can cause poor membrane-electrode interfacial properties. This interfacial property should relate to the MEA delamination and chemical degradation of PEMs7, 8. Thus, further detailed investigations of surface chemical compositions of PEMs are necessary.
The PEMs prepared using irradiation-induced grafting and subsequent sulfonation has been intensively investigated for fuel cell applications over the past 30 years9, 10, 11, 12. Using this technique, many graft-type PEMs have been prepared successfully such as poly(styrene sulfonic acid) (PSSA)-grafted onto poly(ethylene) (PE-PEM)8, poly(tetrafluoroethylene-co-hexafluoropropylene) (FEP-PEM)9, poly(tetrafluoroethylene-co-perfluorovinyl ether) (PFA-PEM)10, poly(tetrafluoroethylene) (PTFE-PEM)11, 12, alicyclic polyimides (API-PEM)13, and poly(ethylene-co-tetrafluoroethylene) (ETFE-PEM) 14, 15, 16, 17, 18, 19, 20, 21, 22. The surface studies of these graft-type PEMs have suggested that the specific elemental compositions (i.e., C, F, O, and S) at the surface layers significantly influence their interfacial properties and chemical stability. In other words, it has an impact on the PEMFC performance. Especially, the sulfur concentration is an important indicator of surface feature because it is one of the components of sulfonic acid groups, i.e., the functional conducting groups. These groups relate strongly to the various physical-chemical properties of PEMs, such as ion exchange capacity, water uptake, conductance, swelling, mechanical strength, etc. These properties, in turn, involve the efficiency and durability of PEM fuel cells closely. However, there have been no detailed reports on this component feature.
Moreover, there has been no report on this issue for the ETFE-PEMs, which have been recently recognized as a superior membrane among fully or partially fluorinated graft-type PEMs14, 15, 16, 17, 18, 19, 20, 21, 22. In detail, the chemical structures of ETFE-PEMs14, 15 and their morphological changes 16, 17, 18, 19, 20, 21, 22 have been previously well-studied using other characterizations, except for the graft distribution at the surface layers and within the bulk due to the shortage of meaningful data. Hence, the objective of this study is to report on the surface characterization of ETFE-PEMs using S2p XPS analyses, which is a reasonable representation to evaluate the evolution of functional PSSA grafts with increasing GDs. Based on the results obtained from XPS measurements, the relationship between the surface features and the chemical degradation and electrolyte properties for fuel cell applications is also discussed.
EXPERIMENTAL
Materials
The commercial 50-μm-thickness ETFE films were purchased from AGC, Ltd. (Japan), and other chemicals (i.e., styrene, 1,2-dichloroethane, acetone, toluene, and chlorosulfonic acid) were provided from Wako Pure Chemical Industries, Ltd. (Japan). All the chemical substances were then used without further purification. Water was purified using a Millipore Milli-Q UV system producing a resistance of 18.2 MΩ.cm and total organic carbon content of < 10 ppb.
ETFE-PEM reparation
The general procedures for preparation and chemical structures of ETFE, grafted ETFE, and ETFE-PEM are depicted in Figure 1. The preparations were comprehensively described in our recent publications14, 15. Thus, the present study just shortly outlines it as follows. The ETFE films were irradiated by g-rays emitted from the Co source under argon conditions with an absorbed dose of 15 kGy and a dose rate of 15 kGy/h. The irradiated samples were then immersed in a styrene/toluene mixture with different concentrations at 60 C for graft polymerization to obtain polystyrene-grafted ETFE (grafted-ETFE) films. The grafted films were then soaked in a 0.2 M chlorosulfonic acid solution in a 1,2-dichloroethane at 50 C (about 6 hours) for sulfonation. The membrane were finally hydrolysis by pure water at 50 °C for 24 h to obtain ETFE-PEMs 13, 14.

Preparation procedure and chemical structures of ETFE, grafted ETFE, andETFE-PEMs. The membranes were prepared using pre-irradiated grafting of styrene onto the ETFE substrate and subsequent sulfonation.
Characterization
The grafting degree (GD) is determined based on the formula: GD (%) = 100(W– W)/W, where W and W are, respectively, the mass of the sample before and after the grafting process. This is the main factor in defining the amount of grafted materials during the propagation. Besides, the sulfonation degree (SD), which is defined as the number of available sulfonic acid groups, is determined by acid-base back titration using an automatic titrator (HIRANUMA COM-555) as the following equation14, 15: SD (%) = 0.01V x100(100+GD)/(dry weight of membrane x GD), where V is the consumed volume (ml) of the 0.01 M NaOH solution. Other electrolyte properties of ETFE-PEMs, such as water uptake, ion exchange capacity, proton conductivity, and mechanical strength, were described in the previous papers 14, 15.
XPS measurement
Figure 2 shows the schematically basic principle of XPS measurement. This surface-sensitively quantitative technique gives the empirical formula, chemical and electronic states of the elements existing within a material surface. XPS spectra are obtained by irradiating the sample with the focus X-ray beam. At the same time, the number of electrons and their kinetic energy (KE) escaping from its top layers of 1-10 nm are recorded. Because the incident X-ray energy (E = hu) equals a known quantity and the same calibrated Fermi levels as shown in Figure 2, the electron binding energy (BE) of the ejected electrons can be directly determined through the work function of the spectrometer () by using the following equation (1):
The surface chemical compositions of all samples were measured using a Thermo Fisher K-Alpha spectrometer equipped with a hemispherical analyzer. A monochromatic X-ray Al Kα source (hu = 1486.6 eV) with a voltage of 12 kV and an emission current of 3 mA was employed. The beam spot size is 400 μm for all spectra, while a compensating electron flood gun was used for surface charge neutralization to minimize the charging effect under a maintained pressure of ultrahigh vacuum (10 mbar). An energy scale of the concentric hemispherical analyzer system was tested with quality control procedures and adjusted in accordance with Au4f (84.0 eV), Ag3d (368.2 eV), and Cu2p (932.6 eV) lines of standards before measurements to ensure reproducible results within acceptable limits. Namely, the repeated statistical quality of the acquired spectral data (30 scans) can be used for the transfer of meaningful data without any further statistical analysis. These intensity data of ETFE-PEMs are then evaluated by other repeated spectra (i.e., divide this by the initial spectrum as a function of kinetic energy) to confirm that no significant change has occurred to the sample or spectrometer during acquisition23. In S2p levels, precision may vary by only a few tenths of percentages due to its moderate photoelectron cross-sections24 for the 1486.6 eV Al Ka lines. Thus, the accuracy of the relative sensitivity factors is as good as 1.881, given a minor error (~2-10%) compared to other surface analyses such as atomic force microscope (AFM), low energy electron diffraction (LEED), electron energy loss spectroscopy (ELS), etc.25 XPS spectra were recorded with an analyzer pass energy of 100.0 eV (step size = 0.5 eV) for the survey scan and 20.0 eV (step size = 0.05 eV) for the narrow scans. Atomic concentrations were then manipulated and quantified using the CasaXPS (version 2.2.107). The narrow scan analyses are conducted by using PeakFit (version 4.12) data processing software. The deconvolution of narrow scan spectra was performed with the considerable assignment of peak component, is ensured by the good quality of the raw data (i.e., the energy solution and signal to noise), the high-resolution XPS of organic polymer database26, and the relevant graft-type PEM reports8, 9, 10, 11, 12, 27, 28. The restricted full width at half maximum (FWHM) values was also conducted to obtain the meaningful component percentages.
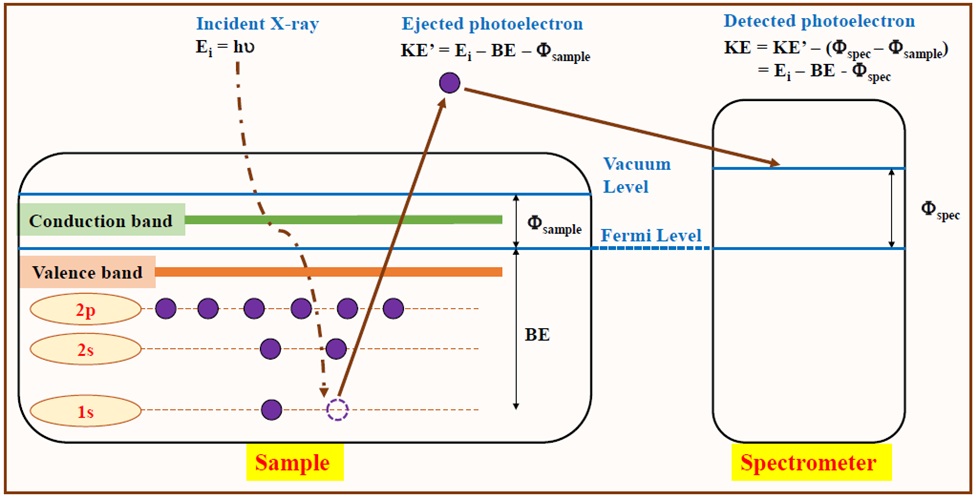
Schematic of the principles of XPS. A typical XPS spectrum is a plot of the number of detected electrons versus their corresponding BE. Each element near the surface region produces a specific set of peaks at characteristic BEs.
RESULT
Figure 3 illustrates the survey-wide scan spectra of ETFE-PEMs in the GD range of 55-101%. Characteristic functional grafted chains, i.e., the PSSA groups, can be elucidated based on S2p representative due to the presence of the sulfonic acid group () generated by the sulfonation process26, 27, 28. Namely, peaks at 169.1 eV for GDs at 55 and 77% and 169.6 eV for a GD of 101% are ascribed to the S2p feature of sulfonic acid groups8, 9, 10, 11, 12. Therefore, increasing GD results in a change in those peak intensities and areas. The calculated atomic concentrations are represented in Table 1. The results show that the sulfur concentrations slightly decrease from 6.1 to 4.9%, with GDs ranging from 55 to 101%, corresponding to SDs of 87–83%.

Survey-wide scan spectra of ETFE-PEMs with various GDs. All spectra features ofthe primary sulfur elemental composition are clearly observed.
The values of BEs and sulfur atomic concentration of the ETFE-PEMs with various GDs and SDs
|
GD (%) |
55 |
77 |
101 |
|
SD (%) |
87 |
85 |
83 |
|
BE (eV) |
169.1 |
169.1 |
169.6 |
|
Sulfur concentration (%) |
6.1 |
5.7 |
4.9 |
Figure 4a represents the narrow scan of S2p spectra of ETFE-PEMs having various GDs. A predominant peak at the lower BE region (168.2-168.6 eV) is observed together with another weaker one locates at, the higher BE (169.4-169.8 eV). Because the S2p core level consists of two well-defined total angular momentum quantum numbers (j) of 1/2 and 3/2, this doublet of the line shape reveals the characteristic S2p-S2p1/2 spin-orbit splitting. Namely, the degeneracy or the area ratio between the lower and higher j values is given by 2:1, corresponding to, respectively, 4 and 2 electrons in the 2p3/2 and 2p1/2 levels29. To further investigate the changes taking place in the surface compositions, the S2p core level spectra are deconvoluted via two models. The first model is based on the assumption that only the main product of sulfonic acid groups () exists in the membranes. A similar assumption was also reported in sulfonated silica/Nafion30 and sulfonated PEEK membranes31. In this case, the S2p spectra are deconvoluted into two components (two-component model) with BEs of 168.4 and 169.6 eV (Figure 4b). These peaks are reasonably assigned to two characteristic spin-orbit components of S2p, i.e., 2p3/2 and 2p1/2 of . The second model is based on the assumption that the membranes contain the main product of plus other by-products such as S-C, S=C, S=O (), S-Cl, etc. In this case, the S2p spectra are deconvoluted into four components (four-component model) with BEs of 167.3, 168.5, 168.9, and 169.7 eV. The two major peaks at 168.5 and 169.6 eV are assigned to the higher oxidation state of , as the case of two-component model. Meanwhile, the remaining minor peaks at 167.3 and 168.9 eV are attributed to the 2p3/2 and 2p1/2 of the lower oxidation state of by-products due to their electronegativity. The undesired reactions may form these by-products during the sulfonation process9, 11, 12, 32. All the chemical characteristics for a pair of spin-orbit splitting are separated by a DBE of nearly 1.18 eV and given concentration ratios of nearly 2.0, which is a complete agreement with those in the literature26, 29, 30.

(a) High-resolution S2p spectra of the ETFE-PEMs having various GDs. (b)-(c) The corresponding deconvoluted models of S2p narrow scans of the ETFE-PEM with a GD of 77%. (a) The line shape indicates at least two peaks, locating at the separated BEs. (b) Illustration of two-component model and (c) four-component model.
Figure 5 shows all the deconvoluted results of ETFE-PEMs with GDs of 55-101%. The corresponding parameters of each component of deconvolution, such as BE, FWHM, and concentration percentage, are represented in Table 2. For the two-component model (Figures 5a and 5b), it can be seen that the BEs of 2p3/2 and 2p1/2 peaks show almost no shifts (168.7-168.3 and 169.9-169.5 eV, respectively). The corresponding FWHM values are also constrained (1.07-1.14 and 1.18-1.21 eV) over the entire GD range. Meantime, the concentration percentages of those states are varied unclear, e.g., from 67.8 to 72.8 then 68.3% (for 2p3/2) and from 32.2 to 27.2 and 31.7% (for 2p1/2). On the other hand, for the four-component model, the spectra feature of and S-X (S-C, S=C, S=O (), S-Cl, etc.) in Figure 5c-f exhibit the stabilized BEs within 168.3-170.0 and 167.3-169.4 eV, and the constrained FWHM values of 1.00-1.21 and 0.9-1.33 eV, respectively. Interestingly, the peak positions and peak widths in both models are the same despite the presence of additional S-X species. However, the two-component model results in suspectable percentages, , the unclear trends of S2p3/2 with GDs of 55-77% and 77-101%. In contrast, the four-component model shows the clear trend of S2p3/2 and S2p1/2 components with increasing GD.
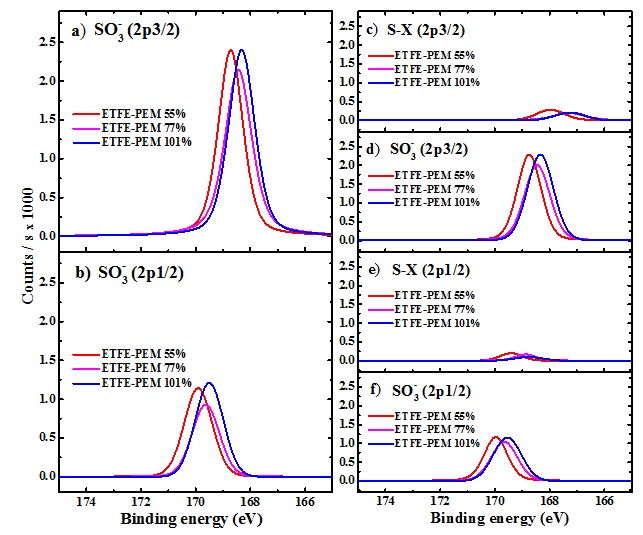
The characteristic spin-orbit components of S2p of the ETFE-PEMs with various GDs. (a) and (b) Deconvoluted peaks using the two-component model. (c)-(f) Deconvoluted peaks using the four-component model.
The deconvoluted results (BEs, FWHM, and percentage) of S2p spectra of ETFE-PEMs with GD = 55-101%. These results are obtained by using the two-component model and four-component model
|
Model |
GD (%) |
BE (eV) |
FWHM (eV) |
Percentage (%) | |||||||||
|
|
|
S-X (2p3/2) |
S-X (2p1/2) |
|
|
S-X (2p3/2) |
S-X (2p1/2) |
|
|
S-X (2p3/2) |
S-X (2p1/2) | ||
|
Two-component model |
55 |
168.7 |
169.9 |
- |
- |
1.07 |
1.21 |
- |
- |
67.8 |
32.2 |
- |
- |
|
77 |
168.4 |
169.6 |
- |
- |
1.16 |
1.18 |
- |
- |
72.8 |
27.2 |
- |
- | |
|
101 |
168.3 |
169.5 |
- |
- |
1.14 |
1.21 |
- |
- |
68.3 |
31.7 |
- |
- | |
|
Four-component model |
55 |
168.7 |
170.0 |
168.0 |
169.4 |
1.03 |
1.00 |
1.21 |
0.94 |
57.4 |
29.6 |
8.3 |
4.7 |
|
77 |
168.5 |
169.7 |
167.3 |
168.9 |
1.10 |
1.13 |
1.33 |
0.90 |
57.6 |
29.9 |
7.7 |
4.8 | |
|
101 |
168.3 |
169.5 |
167.3 |
168.8 |
1.13 |
1.21 |
1.29 |
1.23 |
59.8 |
31.5 |
6.0 |
2.7 | |
DISCUSSION
The surface sulfur concentration representatives of ETFE-PEMs show only a gradual decrease as compared with the high increase of GD from 55 to 101%, corresponding to SDs from 87 to 83% (
As presented in Table 2, the four-component model reflects well the surface features, and thus, its results are used to discuss further. Over the entire GD range, the percentages of the sole product of always dominate on the membrane surfaces (87.0-91.3%), while that of the by-product groups are steadily depleted (13.0-8.7%). Thus, the sulfonic acid groups play a key role on the top layers, affecting the interfacial properties12, 29, 39. Particularly, although the high increase of GD from 55 to 101% provides a large content of the incorporated PSSA grafts, there is only a slow accumulation of sulfonic acid groups (% = 87.0-91.3%) on the top layers of membranes. Because the PSSA graft chains could be generated either at the surface or bulk of the ETFE-PEMs but not follow the front mechanism38, this observation suggests more PSSA grafts inside the bulk. The increase of components using a four-component model (Table 2) is by the corresponding electrochemical properties such as ion exchange capacity and proton conductivity of the same ETFE-PEMs with increasing GD as reported previously15. In such a case, the high IEC of ETFE-PEMs clearly assists the presence of more groups in the bulk rather than on the surface, leading to the competitive proton conductivity to those of the commercial Nafion-21214, 15. Moreover, as mentioned above, this significant surface signature of ETFE-PEMs should show less brittleness and/or less chemical degradation8, 12, displaying an advantageous property for fuel cell applications.
CONCLUSION
The surface sulfur concentration of the ETFE-PEMs prepared by pre-irradiated grafting within the GD range of 55-101% was investigated by using S2p XPS analysis. The obtained results indicate that the membrane surfaces were less accumulation of PSSA grafts. Moreover, among all possible sulfonation products, the sulfur species originated from sulfonic acid groups () are predominance. The less sulfur concentration at the surface layers and the only steady increase of with a high increase of GD indicate that the PSSA grafts were mainly generated inside the bulk rather than on the membrane surface due to the morphological changes. Therefore, all the above observations should provide a further understanding of the important role of groups in the interfacial properties, and thus, the stability. It shows the significant advantages of graft-type ETFE-PEMs in term of surface properties for the PEMFC applications.
LIST OF ABBREVIATIONS
ETFE: Poly(Ethylene-co-TetraFluoroEthylene)
PEMFC: Polymer Electrolyte Membranes Fuel Cell
IEC: Ion Exchange Capacity
XPS: X-ray Photoelectron Spectroscopy
GD: Grafting Degree
PS: Poly Styrene
PSSA: Poly Styrene Sulfonic Acid
COMPETING INTERESTS
There are no conflicts of interest to declare.
ACKNOWLEDGMENTS
This research is funded by Vingroup Big Data Institude (VINBIGDATA), Vingroup and supported by Vingroup Innovation Foundation (VINIF) under project code VINIF.2020.DA08.
Authors Contribution
Tran Duy Tap: Conceptualization, Project administration, Fundingacquisition, Supervision, Resources, Investigation, Methodology, Data curation, Formal analysis, Supervision, Validation, Visualization, Writing - original draft, Writing - review & editing. Lam Hoang Hao: Investigation, Methodology, Data curation, Formal analysis, Validation, Visualization, Writing - original draft, Writing - review & editing. Dinh Tran Trong Hieu: Visualization, Validation, Writing - review & editing. Tran Thanh Danh and Tran Van Man: Visualization, Validation. Tran Hoang Long: Visualization, Investigation. Huynh Truc Phuong and Le Quang Luan: Visualization. Luu Anh Tuyen and Pham Kim Ngoc: Visualization, Validation, Data curation.