

Initial development of a linear regression model to determine the copper (ii) ion content via a photometric method
- Department of Chemistry, College of Natural Sciences, Can Tho University, Can Tho, Viet Nam
Abstract
Introduction: This study, which was first conducted in Vietnam, aimed to develop a multivariable and simple-variable linear regression model from the direct measurement of the UV‒Vis absorption of copper(II) ions in aqueous solution without using other reagents (chelating agents and solvents), which reduces environmental pollution and analysis fees.
Methods: Simple-variable and multivariable linear regression models were developed from UV‒Vis spectral data of copper(II) ion solutions with concentrations ranging from 0.2 to 50 ppm.
Results: Four multivariable regression models were developed and modified, and the optimal simple variable regression model was selected. This study analyzed the suitability of single and multivariable models for the analysis of copper(II) ions in aqueous solution at low concentrations.
Conclusion: This study successfully built and adjusted linear regression models for predicting the copper(II) ion content in aqueous solution via a photometric method. The multivariable model with odd variables (model No. 2’) and the simple-variable model at a wavelength of 221 were optimized for use in the prediction of the concentration at an acceptable level of 0.5 ppm. These results were verified by the graph of the correlation between the true concentration and the predicted concentration in both selected models. In particular, the multivariate model yields significantly more accurate prediction results than does the simple-variable model.
INTRODUCTION
The concentration of heavy metal ions is usually determined by methods such as complexometric titration, voltammetric methods, and photometric methods (UV‒Vis), among others. Atomic absorption spectrometry (AAS)1 or electrothermal atomic absorption spectrometry (ETAAS) are among the most commonly used techniques for trace element analyses of minerals.2 In addition, there are more sophisticated methods, such as inductively coupled plasma optical emission spectroscopy (ICP-MS), which uses plasma to analyze trace metal ions in beverages,3 and high-resolution inductively coupled plasma‒mass spectrometry (HR-ICP-MS), which has an electrical and magnetic region for ion separation and concentration in industrial wastewater analysis.4 These analytical methods provide high selectivity, high sensitivity and low detection limits, but the equipment is complicated and quite expensive. For example, Huang and Shih (1993) directly detected copper in seawater samples using a graphite furnace atomic absorption spectrometer (GFAAS) with high accuracy and precision to detect Cu(II), where the detection limit of Cu(II) was in the range of 0.3–0.4 µg. L when injected with 20 µl of seawater, which further decreased to 0.07 µg. L with multiple injections.5 An optimized single-particle ICP-MS technique (spICP-MS) was used by Venkatesan et al. (2018) to analyze Pb, Fe, Sn, Cu, and Ag in tap water samples. spICP-MS is a time-resolved analysis in which particles are detected as collisions above the elemental background signal. This instrument detected Cu(II) in 25 water samples in the temperature range of 15–136 ng.L.6
In Vietnam, the fluorescent chemosensor in the UV‒Vis machine has been researched by Duong Tuan Quang and his associates since 2007 with a number of publications, such as a chemical sensor based on calix[4]arene to detect the ions Fe, F, Cs, Cu; or dimethylaminocinnamaldehydeaminothiourea to detect Ag, Cu, Hg; and a chemical sensor containing a 1,2,3-triazole ring that detects Al or chemical sensors that detect Hg synthesized from rhodamine derivatives or fluorescent reagents.7, 8, 9, 10
This photometric method requires no user training, simple equipment, and easy sample handling. Currently, in Vietnam and around the world, copper(II) ions are analyzed by this method, and researchers use reagents in combination with copper(II) ions to form complexes whose color is detected in the Vis region. A study by Sharma et al. (2010) showed that copper can be detected at the maximum absorption wavelength (336 nm) through the use of a novel UV spectroscopy method (Shimadzu UV–Visible 160 A spectrometer) based on the formation of complexes of Cu(II) ions with cefixime immediately in a 1,4-dioxan-distilled water medium at room temperature. In this study, the proposed method was able to analyze Cu(II) in natural water samples with a detection limit of 3.19 × 10 µg/mL.11 The reagent 1-(2-pyridylazo)-2-naphthol (PAN) was used to analyze copper in sugarcane spirit. Complexation at pH 4.50 for 5 min at 20 °C requires a malonic acid coating to reduce the influence of iron(III) and nickel(II) ions. Linearity was obtained with a copper(II) concentration of 8.00 mg/L, and the limits of detection and quantification were 0.02 mg/L and 0.13 mg/L, respectively.12
In 2012, Omar et al. adopted near-infrared spectroscopy analysis in the commonly used 700 to 1100 nm range to reliably determine the dissolved solids content in fruit. The aim was to optically profile the sugar-water solution and determine the peak wavelength in the quantification of the sugar concentration.13 This method was developed for the analysis of metal ions (copper and lead) in aqueous solution in 2014 by Tan's research group at the University of Sains, Malaysia. This research group has produced multivariable and simple-variable linear regression models for the analysis of metal ions at low concentrations from 0.2 to 10 ppm by photometric methods without using any reagents.14
This is the initial study of a multivariable and simple-variable linear regression model for the direct measurement of the UV‒Vis absorption of copper(II) ions in aqueous solution without the use of other reagents (chelating agents and solvents), which reduces environmental pollution and analysis fees. This study was first conducted in Vietnam with the desire to contribute to the expansion of analytical methods that do not use chemical reagents.
MATERIALS AND METHODS
General information
All chemicals used in this study were of analytical grade. UV‒ Vis spectra were measured using a UV‒ Vis instrument (Jasco V-730). The data were analyzed by Microsoft Excel.
General method for preparation of samples
, 2,683 mg of CuCl·2HO was accurately weighed into a 100 mL beaker to dissolve enough distilled water, after which the solution in the beaker was transferred to a 1 L volumetric flask, and distilled water was added. The flask was closed tightly and shaken by inverting several times until the solution was homogeneous.
: From the 1000 ppm stock standard, a series of intermediate standards with concentrations of 5 ppm, 10 ppm, 20 ppm, 30 ppm, 40 ppm and 50 ppm were prepared.
: From the 5 ppm intermediate standard solution, a series of intermediate standards with concentrations of 0.2 ppm, 0.5 ppm, 1 ppm and 2 ppm were prepared.
Experiment
Intermediate standard solutions of 5-50 ppm concentration were used to measure the absorbance in triplicate. The results of the spectrum were used to develop the regression model.
Standard solutions with low concentrations of 0.2-2 ppm were measured for absorbance in triplicate. The results of the spectra were subjected to the optimized regression model to calculate the amount of copper(II) ions.
Data processing
: To select the appropriate wavelength for the the linear regression model (LRM) structure, the noisy and near-baseline regions need to be removed.
: After wavelength selection, the data exported from the spectra were analyzed via multivariate LRM with the proposed models. Next, we identify the independent variables that have a weak correlation with the dependent variable and remove them. The multivariable LMR run was repeated with the remaining variables, and the linear regression equation (LRE) was determined. There are four proposed multivariate LRMs:
-
Model No. 1: The selected variables have values of 1 wavelength apart;
-
Model No. 2: The selected variables have even wavelengths;
-
Model No. 2’: The selected variables have odd wavelengths;
-
Model No. 3: The selected variables have 5 different wavelengths.
: After optimization, the simple-variable LMR for each variable corresponding to different wavelengths is analyzed for the variables selected in the multivariable model.
, the data exported from the spectra were analyzed by multivariate and simple variable LRM, which were optimized.
Conditions for satisfying the optimal model
The optimal model is the model with no more than 5 independent variables; 0.99 ≤ R ≤ 1 and adjusted R between 0.5 – 1; small standard error - error (10); absolute deviation - bias (%) < 15% (according to many organizations in the US, Canada, Europe – ISO 3534-1)
RESULTS
The appropriate wavelength range
The experiment was conducted using a two-channel spectrometer with wavelengths ranging from 200 nm to 1100 nm. However, the results show that channel 1 (wavelengths of 650 nm to 1100 nm) is not Visible at low concentrations of Cu. Moreover, measurements through channel 0 (200 nm to 650 nm) produced a significant coefficient of determination, R, between the absorbance and copper ion concentration. Spectroscopic results in the 200-230 nm working region show that the data at wavelengths below 217 nm are noisy (Figure 1). Therefore, the extreme negative peak near 217 nm was neglected in this study.

The appropriate wavelength range of copper(II) ion solutions with concentrations ranging from 0.2 to 50 ppm
The multivariable LRM
Model No.1
In the selected working area from 217-230 nm, the regression coefficients of wavelengths 217, 219, 220, 223, 226, 227, 229 and 230 and the intercept show a weak correlation with the regression equation and should be rejected.
The results of the error analysis and absolute bias of adjusted model No.1
|
True C (ppm) |
Pred. C (ppm) |
Error (10-3) |
Bias (%) |
|
5 |
5.09 |
0.478 |
1.85 |
|
5 |
5.33 |
6.056 |
6.60 |
|
5 |
5.05 |
0.148 |
1.03 |
|
10 |
10.01 |
0.005 |
0.10 |
|
10 |
9.89 |
0.708 |
1.13 |
|
10 |
10.00 |
0.001 |
0.05 |
|
20 |
20.05 |
0.152 |
0.26 |
|
20 |
19.90 |
0.607 |
0.52 |
|
20 |
20.23 |
2.866 |
1.14 |
|
30 |
29.85 |
1.268 |
0.50 |
|
30 |
29.96 |
0.079 |
0.13 |
|
30 |
30.02 |
0.018 |
0.06 |
|
40 |
40.01 |
0.009 |
0.03 |
|
40 |
39.96 |
0.083 |
0.10 |
|
40 |
40.02 |
0.023 |
0.05 |
|
50 |
50.04 |
0.087 |
0.08 |
|
50 |
49.94 |
0.186 |
0.12 |
|
50 |
50.02 |
0.028 |
0.05 |
|
Average |
0.711 |
0.77 | |
The result of the model No. 1 modification is linear regression equation-1 C = 9.5xD218 – 29.6xD221 – 8.8xD222 + 105.3xD224 – 15.1xD225 -36.5xD228 (LRE-1), with a mean error and absolute deviation of 0.711 and 0.77, respectively (
Models No. 2 and No. 2’
For Model No. 2, the intercept and regression coefficients at 218, 220 and 222 nm show a weak correlation with the model, so they are ignored. After recalibration, this model gives the equation C = 95.2xD224 - 38.9xD226 – 96.6xD228 + 60.7xD230 (LRE-2). However, at odd wavelengths (model No. 2’), the model is corrected after removing the variable with a weak correlation at wavelengths 217 and 227 nm, and the equation C = 11.5xD219 – 23.9xD221 + 78.6xD223 – 13.1xD225 – 56.4xD229 (LRE-3) is obtained. The adjusted coefficients of determination for both models (No. 2 and No. 2’) are 0.92850 and 0.92302, respectively.
The results of the error analysis and absolute bias of adjusted models No. 2 and No. 2
|
True C (ppm) |
Model No.2 |
Model No.2' | ||
|
Error (10-3) |
Bias (%) |
Error (10-3) |
Bias (%) | |
|
5 |
4.704 |
5.8 |
0.148 |
1.0 |
|
5 |
1.718 |
3.5 |
5.021 |
6.0 |
|
5 |
0.157 |
1.1 |
3.668 |
5.1 |
|
10 |
0.357 |
0.8 |
0.655 |
1.1 |
|
10 |
1.782 |
1.8 |
0.613 |
1.1 |
|
10 |
0.924 |
1.3 |
6.227 |
3.3 |
|
20 |
8.081 |
1.9 |
0.001 |
0.0 |
|
20 |
0.048 |
0.1 |
0.518 |
0.5 |
|
20 |
4.347 |
1.4 |
6.693 |
1.7 |
|
30 |
8.569 |
1.3 |
0.062 |
0.1 |
|
30 |
0.046 |
0.1 |
4.825 |
1.0 |
|
30 |
0.312 |
0.2 |
0.710 |
0.4 |
|
40 |
1.649 |
0.4 |
0.535 |
0.2 |
|
40 |
0.024 |
0.1 |
7.438 |
0.9 |
|
40 |
0.339 |
0.2 |
1.115 |
0.4 |
|
50 |
2.026 |
0.4 |
0.210 |
0.1 |
|
50 |
1.358 |
0.3 |
0.118 |
0.1 |
|
50 |
11.667 |
0.9 |
0.026 |
0.0 |
|
Average |
2.673 |
1.2 |
2.144 |
1.3 |
Model No.3
The number of independent variables in this model is the lowest when the independent variables have a long jump (5 nm). After adjusting to remove the weak correlation to the dependent variable of the constant, this model has 3 independent variables with C = 11.9xD220 + 33.2xD225 – 29.2xD230 (LRE-4) and R = 0.93318.
The results of the error analysis and absolute bias of adjusted model No. 3
|
True C (ppm) |
Pred. C (ppm) |
Error (10-3) |
Bias % |
|
5 |
5.018 |
0.018 |
0.36 |
|
5 |
4.974 |
0.038 |
0.52 |
|
5 |
5.282 |
4.421 |
5.64 |
|
10 |
10.036 |
0.072 |
0.36 |
|
10 |
9.770 |
2.928 |
2.30 |
|
10 |
10.360 |
7.193 |
3.60 |
|
20 |
19.991 |
0.004 |
0.04 |
|
20 |
19.720 |
4.349 |
1.40 |
|
20 |
20.380 |
8.041 |
1.90 |
|
30 |
29.956 |
0.107 |
0.15 |
|
30 |
29.657 |
6.539 |
1.14 |
|
30 |
30.549 |
16.756 |
1.83 |
|
40 |
40.424 |
9.989 |
1.06 |
|
40 |
39.256 |
30.711 |
1.86 |
|
40 |
40.041 |
0.094 |
0.10 |
|
50 |
50.100 |
0.552 |
0.20 |
|
50 |
49.408 |
19.473 |
1.18 |
|
50 |
50.476 |
12.579 |
0.95 |
|
Average |
6.881 |
1.37 | |
This model has the advantage of the number of independent variables, but the results of the analysis of the parameters (
The simple-variable LRM
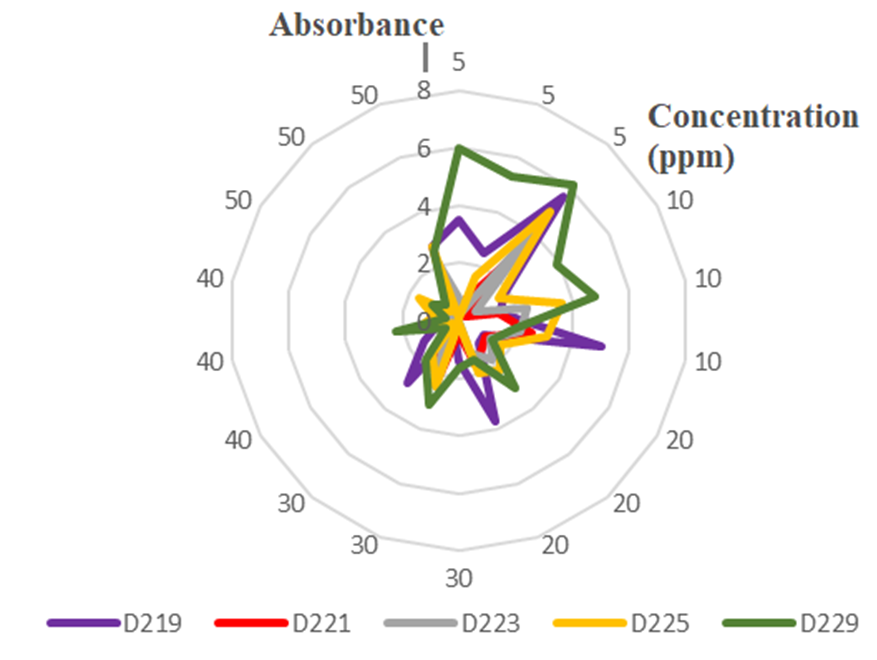
The variables selected in Model adjusted No. 2 have variables at 219, 221, 223, 225 and 229 nm. At each of these wavelengths, simple-variable regression analysis is performed and modified when the intercept is not significant for the model.

The absolute deviation at different wavelengths of copper(II) ion solutions with concentrations ranging from 5 to 50 ppm (the vertical numbers are Abs, and the numbers around the circle are the concentrations of Cu2+).
The absolute deviation of concentrations in simple-variable regression analysis at different wavelengths shows that lower concentrations (5 and 10 ppm) have much larger deviations at higher concentrations (Figure 2). In
The results of the error analysis and absolute bias for model No. 2’ and the simple-variable LRM at different wavelengths
|
True C (ppm) |
D219 |
D221 |
D223 |
D225 |
D229 |
Model No.2' | ||||||
|
Error (10-3) |
Bias (%) |
Error (10-3) |
Bias (%) |
Error (10-3) |
Bias (%) |
Error (10-3) |
Bias (%) |
Error (10-3) |
Bias (%) |
Error (10-3) |
Bias (%) | |
|
5 |
1.706 |
3.50 |
0.026 |
0.43 |
0.089 |
0.80 |
0.001 |
0.10 |
4.953 |
5.97 |
0.148 |
1.03 |
|
5 |
0.882 |
2.52 |
0.097 |
0.84 |
0.016 |
0.34 |
0.367 |
1.63 |
3.940 |
5.33 |
0.655 |
6.01 |
|
5 |
4.374 |
5.61 |
1.112 |
2.83 |
2.726 |
4.43 |
3.371 |
4.93 |
5.269 |
6.16 |
0.001 |
5.14 |
|
10 |
1.804 |
1.80 |
0.045 |
0.28 |
0.260 |
0.68 |
1.401 |
1.59 |
8.509 |
3.91 |
0.062 |
1.09 |
|
10 |
1.161 |
1.45 |
1.134 |
1.43 |
3.202 |
2.40 |
7.255 |
3.61 |
12.703 |
4.78 |
0.535 |
1.05 |
|
10 |
14.232 |
5.06 |
3.671 |
2.57 |
2.614 |
2.17 |
5.419 |
3.12 |
1.898 |
1.85 |
0.210 |
3.35 |
|
20 |
2.263 |
1.01 |
2.556 |
1.07 |
3.439 |
1.24 |
5.944 |
1.64 |
3.736 |
1.30 |
5.021 |
0.02 |
|
20 |
2.461 |
1.05 |
3.336 |
1.23 |
6.781 |
1.75 |
11.229 |
2.25 |
20.532 |
3.04 |
0.613 |
0.48 |
|
20 |
30.816 |
3.72 |
5.862 |
1.62 |
3.086 |
1.18 |
8.374 |
1.94 |
4.586 |
1.44 |
0.518 |
1.74 |
|
30 |
10.272 |
1.43 |
1.059 |
0.46 |
0.011 |
0.05 |
0.051 |
0.10 |
13.919 |
1.67 |
4.825 |
0.11 |
|
30 |
1.040 |
0.46 |
23.255 |
2.16 |
28.950 |
2.41 |
29.845 |
2.44 |
48.832 |
3.13 |
7.438 |
0.98 |
|
30 |
39.869 |
2.82 |
9.362 |
1.37 |
3.094 |
0.79 |
10.376 |
1.44 |
16.294 |
1.81 |
0.118 |
0.38 |
|
40 |
17.832 |
1.42 |
1.733 |
0.44 |
0.018 |
0.05 |
0.377 |
0.21 |
2.884 |
0.57 |
3.668 |
0.25 |
|
40 |
5.660 |
0.80 |
27.390 |
1.76 |
27.476 |
1.76 |
19.964 |
1.50 |
45.316 |
2.26 |
6.227 |
0.91 |
|
40 |
8.775 |
0.99 |
0.263 |
0.17 |
2.795 |
0.56 |
7.114 |
0.89 |
2.089 |
0.48 |
6.693 |
0.35 |
|
50 |
2.948 |
0.46 |
10.381 |
0.86 |
0.890 |
0.25 |
35.009 |
1.59 |
15.270 |
1.05 |
0.710 |
0.12 |
|
50 |
2.113 |
0.39 |
5.730 |
0.64 |
3.206 |
0.48 |
2.545 |
0.43 |
7.391 |
0.73 |
1.115 |
0.09 |
|
50 |
105.500 |
2.76 |
17.492 |
1.12 |
67.559 |
2.21 |
102.869 |
2.72 |
90.813 |
2.56 |
0.026 |
0.04 |
|
Average |
14.095 |
2.07 |
6.361 |
1.18 |
8.678 |
1.31 |
13.973 |
1.78 |
17.163 |
2.67 |
2.144 |
1.29 |
In conclusion, model-adjusted No. 2’ was chosen as the optimized model for multivariable linear regression analysis, with C = 11.5xD219 – 23.9xD221 + 78.6xD223 – 13.1xD225 – 56.4xD229 (LRE-3) and simple-variable LRM C = 24.923 x D221 (LRE-5).
Applying the optimal models to solutions with low-concentration standard solutions
The absorbance results of the low-concentration standard solutions with a concentration of 0.2-2 ppm were applied to the optimal models, and the results are summarized in
The results of the error analysis and absolute bias of adjusted No. 2’ at low concentrations
|
True C (ppm) |
Pred. C (ppm) |
Error (10-3) |
Bias (%) |
|
0.2 |
0.267 |
0.252 |
33.7 |
|
0.135 |
0.232 |
32.3 | |
|
0.263 |
0.220 |
31.4 | |
|
0.5 |
0.482 |
0.019 |
3.7 |
|
0.470 |
0.049 |
5.9 | |
|
0.470 |
0.050 |
6.0 | |
|
1.0 |
0.903 |
0.527 |
9.7 |
|
0.948 |
0.152 |
5.2 | |
|
0.903 |
0.523 |
9.7 | |
|
2.0 |
2.190 |
2.005 |
9.5 |
|
1.973 |
0.041 |
1.4 | |
|
2.134 |
0.991 |
6.7 |
To determine whether the simple-variable LRM is optimized at a wavelength of 221, this method was applied at each wavelength for concentrations ranging from 0.2-2 ppm, and the results are shown in
The results of the analysis of the parameters at low concentrations
|
True C (ppm) |
0.2 |
0.5 |
1.0 |
2.0 | |
|
D219 |
LRE |
C = 20.589 x Abs (R2 = 0.99972) | |||
|
Pred. C (ppm) |
0.045 |
0.505 |
1.000 |
2.032 | |
|
Error (10-3) |
1.339 |
0.007 |
0.007 |
0.387 | |
|
Bias % |
77.5 |
2.1 |
1.1 |
4.2 | |
|
D221 |
LRE |
C = 24.923 x Abs (R2 = 0.99987) | |||
|
Pred. C (ppm) |
0.132 |
0.492 |
1.017 |
1.953 | |
|
Error (10-3) |
0.259 |
0.006 |
0.017 |
0.227 | |
|
Bias % |
34.1 |
1.9 |
1.7 |
2.3 | |
|
D223 |
LRE |
C = 31.496 x Abs (R2 = 0.99983) | |||
|
Pred. C (ppm) |
0.147 |
0.459 |
0.972 |
2.020 | |
|
Error (10-3) |
0.187 |
0.094 |
0.063 |
0.376 | |
|
Bias % |
26.3 |
8.1 |
2.8 |
4.1 | |
|
D225 |
LRE |
C =40.830 x Abs (R2 = 0.99972) | |||
|
Pred. C (ppm) |
0.062 |
0.470 |
0.924 |
1.973 | |
|
Error (10-3) |
1.058 |
0.069 |
0.810 |
1.649 | |
|
Bias % |
69.0 |
6.1 |
11.4 |
7.6 | |
|
D229 |
LRE |
C = 72.973 x Abs (R2 = 0.99966) | |||
|
Pred. C (ppm) |
0.032 |
0.428 |
1.026 |
2.031 | |
|
Error (10-3) |
1.567 |
0.289 |
0.039 |
0.399 | |
|
Bias % |
84.0 |
14.3 |
2.6 |
4.0 | |
When using the Optimum LRMs to predict copper(II) ions at low concentrations, the analytical results show that the acceptable concentration for this model is no less than 0.5 ppm.

The absolute deviation at different wavelengths of copper(II) ion solutions with concentrations ranging from 0.5 to 2 ppm (the vertical numbers are Abs, and the numbers around the outer ring are the concentrations of Cu2+).
DISCUSSIONS
All of the modified models have adjusted R and R values close to 1 (0.999999), so they are suitable for the requirements set for model selection.
Model No. 1 has a large number of independent variables, making it difficult to predict. Although Model No. 3 has the fewest variables, it has a much larger forecast error than the other models. For models No. 2 and No. 2', when comparing the errors and bias, the 2' model is more suitable for choosing the optimal model.
The result of selecting the multivariable regression model was Model No. 2’ with 5 independent variables: 219, 221, 223, 225 and 229. In addition, the simple-variable regression model was selected with the same wavelength of 221 as Tan's model but different regression coefficients (24.923 and 79.311, respectively).14 When two optimization models were applied to predict copper(II) ions at low concentrations, the results were similar to those of Tan's model, which could predict concentrations of approximately 0.5 ppm (
Verification of the simple-variable LRM at 221 with LRE-5 was performed by calculating analytic concentrations from 0.5 to 50 ppm and then graphing the correlation between the predicted and true concentrations. The analysis results are shown in the graph (Figure 4) and equation y = 0.9999x, which proves that the model used to predict the results is similar (99.99%) to the real value. In addition, this graph clearly shows that the multivariate model (model No. 2’) is significantly better suited for forecasting than the simple-variable model with the correlation function y = x.

Correlation between the true and predicted concentrations of the simple-variable LRM at 221 nm and model No. 2’
CONCLUSION
This study successfully developed simple-variable and multivariable linear regression models for copper(II) ion concentrations in aqueous solutions ranging from 0.2-50 ppm without using any other reagents or solvents in the wavelength range 217-230 nm. The results show that the multivariable model with odd variables (model No. 2’) and the simple-variable model at a wavelength of 221 were optimized for use in predicting the concentration at an acceptable level of 0.5 ppm. These results were verified by the graph of the correlation between the true concentration and the predicted concentration in both selected models. In particular, the multivariate model yields significantly more accurate prediction results than does the simple-variable model.
The results of this study show that the application of multivariate and simple-variable regression models can almost accurately predict low copper(II) ion concentrations (0.5-50 ppm). However, the suitability of the models for analyzing complex samples and the factors affecting the analysis results, such as pH and metal ions, has not yet been investigated. For further research, this technique can be simplified to a more portable device at a lower cost using modern equipment.
COMPETING INTERESTS
The authors declare that they have no competing interests.
AUTHOR CONTRIBUTIONS
Nguyen Thi Anh Hong conceived the idea and designed the works. Nguyen Thi Thuy Dung and Nguyen Pham Thien Thanh performed experiments. All authors analyzed data, read and final approval manuscript for publication.
ACKNOWLEDGMENT
I would like to express my deepest gratitude to the Department of Chemistry, Faculty of Natural Sciences, Can Tho University for creating favorable conditions for us to complete this research.
ABBREVIATIONS
L is a metric unit of volume (Liter)
LRE The linear regression equation
LRM The linear regression model
ppm Parts per million corresponds to mg/L
R2adj. The adjusted coefficient of determination
UV‒Vis Ultraviolet visible spectrophotometers