

Low-cost synthesis of α-Fe2O3 nanorods for photocatalytic application
- Faculty of Materials Science and Technology, University of Science, Ho Chi Minh City, Vietnam
- Vietnam National University, Ho Chi Minh City, Vietnam
Abstract
Introduction: α-Fe2O3 nanorods (α-Fe2O3 NRs), also known as hematite, possess a narrow band gap, high chemical stability, extensive surface area, controllable size, and outstanding photoelectric properties. These attributes make hematite a promising material for various applications, including gas sensors, optical sensors, and notably, photocatalysis. In previous studies, α-Fe2O3 nanorods were synthesized using various processes. However, these processes involve extensive use of precursors, are expensive, and time-consuming, and have negative impacts on the environment. Hence, this investigation introduces an uncomplicated, efficient, and high-precision hydrothermal process for synthesizing α-Fe2O3 nanorods (α-Fe2O3 NRs).
Methods: We utilized a short-term hydrothermal process to synthesize α-Fe2O3 nanorods. Characterization of the nanorods involved XRD, VESTA, Raman, SEM, and EDX to examine their morphology and structure, with UV-Vis spectroscopy used to determine their absorption spectra. The photocatalytic efficiency of the α-Fe2O3 nanorods was assessed by their ability to degrade methylene blue dye at a concentration of 2.5 ppm.
Results: VESTA simulations and XRD patterns confirmed that the α-Fe2O3 nanorods have a rhombohedral crystal structure and belongs to space group R3 ̅c. The optical bandgap was determined to be 2.2 eV through calculations using Tauc’s method. Through scanning electron microscopy (SEM), the average length and diameter of the α-Fe2O3 NRs were determined to be 415 nm and 110 nm, respectively. The photocatalytic capacity for degrading methylene blue (concentration of 2.5 ppm) was 55%.
Conclusion: This exploration of the fundamental characteristics of α-Fe2O3 NRs offers deeper insights into the properties of nanorod-structured hematite materials. Moreover, the synthesis of α-Fe2O3 NRs using this hydrothermal method addresses several previously identified challenges, thereby contributing to broadening the potential applications of α-Fe2O3 NRs across various fields in the future.
Introduction
In recent decades, the synthesis of one-dimensional (1D) nanostructures has garnered significant attention and extensive research across various fields due to their unique physical and chemical properties1. Additionally, the morphological diversity of one-dimensional nanostructures offers numerous advantages for various applications. For example, nanowires possess a high surface area-to-volume ratio, low defect density, and excellent optical conductivity, making them suitable for various applications, such as nanobiosensors, chemical sensors, gas sensors, and electrochemical sensors2. Due to their high specific surface area, nanotube structures can serve as frameworks or containers for other materials that can be applied in fuel cells, photocatalytic systems, energy storage, gas sensors, etc.,3. One particularly special and easily fabricated form of the 1D nanostructure is nanorods, which are characterized by large surface areas, easily controllable dimensions, and excellent optoelectronic properties. Nanorods have numerous important applications in light-emitting diodes (LEDs), light sensors, photocatalysis, gas sensors, biosensors, etc,.4 Among the various types of 1D materials, α-FeO nanorods, also known as hematite, stand out due to their narrow band gap (approximately 2.2 eV), chemical stability, and nontoxic nature5. This makes hematite a highly significant material in numerous fields, such as magnetic applications6, 7, gas sensors8, lithium-ion batteries9, drug delivery technology10, and particularly photocatalysis11, 12, 13, 14. α-FeO nanorods have been synthesized using various physical and chemical methods, such as sol-gel methods15, hydrothermal methods16, vacuum thermal evaporation methods17, green chemistry methods18, and micelle methods19. However, physical methods often require expensive equipment and complex procedures, leading to limitations in practical applications hence, chemical methods are usually preferred. Among them, the hydrothermal method has become the preferred choice for α-FeO nanorod synthesis due to its low cost, simple synthesis process, and high efficiency compared to other methods. Despite its numerous advantages, hydrothermal synthesis still faces some challenges due to the use of multiple toxic precursors and prolonged reaction times, which can have negative environmental impacts. This can be observed in some previous studies. For instance, Gajendra and colleagues conducted a hydrothermal process for up to 36 hours, with an additional 3 hours required to obtain α-FeO nanorods using precursors such as diammonium phosphate and iron (III) chloride hexahydrate20. Additionally, the research group led by Suyuan Zeng synthesized α-FeO nanorods using a hydrothermal method with a total reaction time of 20 hours, employing sodium sulfite and iron(II) sulfate as precursors21. Furthermore, by utilizing iron(III) nitrate nonahydrate and sodium hydroxide for a 12-hour hydrothermal process, Guo-Ying Zhang and colleagues successfully synthesized α-FeO nanorods for photocatalytic applications22.
In addition to the challenges related to the use of multiple precursors and long synthesis times, most research on photocatalysis only utilizes α-FeO nanorods (NRs) as a supporting material combined with other substances, such as cadmium oxide nanoparticles12, cadmium sulfide nanoparticles23, chromium dopants13, or hybridization with reduced graphene oxide (rGO)24. This inadvertently blurs the distinctive properties of α-FeO NRs in photocatalysis, significantly impacting the optimization and enhancement of material structures to achieve maximum performance for future studies. Therefore, in this study, we focused on developing a simple hydrothermal process that saves time and utilizes fewer precursors to synthesize α-FeO nanorods. Additionally, the properties of the hematite material are examined and clearly presented through a combination of experimental work and simulation calculations. Furthermore, the photocatalytic capability of the α-FeO NRs was investigated through the degradation of methylene blue (MB) dye. With this method, this study not only provides a clearer understanding of the material but also partially addresses some of the abovementioned challenges, thereby contributing to expanding the potential applications of α-FeO nanorods in various fields in the future, both generally and particularly in the field of photocatalysis.
MATERIALS-METHODS
Chemical materials
The chemicals used in this experiment included iron(III) chloride hexahydrate (FeCl·6HO, 99%, SigmaAldrich, USA), sodium nitrate (NaNO, 99%, SigmaAldrich, USA), and methylene blue (82%, SigmaAldrich, USA).
Characteristics
The surface morphology and density of the nanorods were examined using scanning electron microscopy (SEM, Hitachi S-4800). The crystalline structure of the α-FeO nanorods was observed via X-ray diffraction (XRD) performed on a D8 Advance-Bruker X-ray diffractometer operating at 40 kV and 100 mA with a Cu/Kα radiation source (λ = 0.154 nm). The optical properties of the nanorods were determined through UV‒Vis spectroscopy (JASCO V670). Raman spectra were recorded using a Raman spectrometer (Xplora One, HORIBA) with an excitation wavelength of 532 nm, a power of 5 mW, a 10× objective, and an acquisition time adjusted to 15 seconds per spectrum. 3D structural models and XRD patterns based on computational simulations of α-FeO nanorods were generated using VESTA software (Visualization for Electronic Structural Analysis).
The photocatalytic efficiency of the α-FeO nanorods (NRs) was assessed by their ability to degrade methylene blue (MB) dye. The sample, with a size of 2 cm × 2 cm of α-FeO thin film, was added to 20 mL of the 2.5 ppm MB solution and then stirred evenly in the dark for 2 hours to ensure adsorption equilibrium. Subsequently, the sample was irradiated under visible light for 8 hours. The illumination source was a visible light lamp, equivalent to 1 sun, and a cooling fan was utilized to maintain the ambient temperature. The absorbance spectra of the MB solution were recorded at 2-hour intervals.
Fabrication processes
The synthesis of the α-FeO nanorods followed a hydrothermal method similar to that used in Dong Chen's study25. Initially, a solution containing FeCl·6HO (0.15 M) and NaNO (1 M) with a total volume of 10 mL was prepared at room temperature. Once the precursors were completely dissolved in the solution, the mixture was transferred to a 25 mL Teflon-lined autoclave. Subsequently, a clean silicon substrate was placed inside the autoclave, which was then placed in an oven at 100 °C for 4 hours to form FeOOH nanorods. Next, the sample was washed multiple times with deionized water and ethanol to remove impurities. Finally, the FeOOH sample was transferred to a furnace and annealed at 550 °C for 2 hours to convert it into α-FeO nanorods.
RESULTS
The simulated structure of α-FeO is depicted in Figure 1. Hematite possesses a rhombohedral crystal structure and belongs to the space group 26. In each primitive cell, there are two formula units (a = 5.427 Å; a = 55.3) (Figure 1a), whereas the unit cell contains six formula units (a = b = 5.034 Å; c = 13.75 Å) (Figure 1b)27. Furthermore, the arrangement of anions and cations results in an octahedral structure comprising one iron atom and six oxygen atoms (Figure 1c).

Models for the crystal cell structure of α-Fe2O3:a) the rhombohedral primitive cell, b) the conventional unit cell of α-Fe2O3 and (c) the octahedral structure in the unit cell. Top of Form
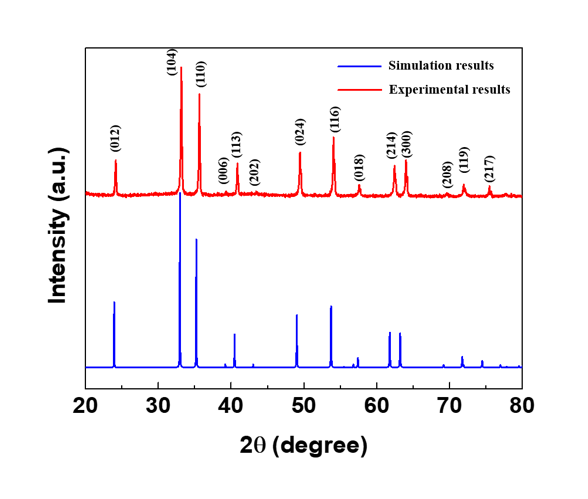
X-ray diffraction (XRD) patterns obtained experimentally and through simulation were utilized to evaluate the crystal structure of α-FeO, as shown in Figure 2. There are 14 characteristic diffraction peaks of α-FeO obtained experimentally at 2θ angles of 24°, 32°, 35°, 39°, 40°, 43°, 49°, 53°, 57°, 61°, 63°, 69°, 71°, and 74° corresponding to lattice planes (012), (104), (110), (006), (113), (202), (024), (116), (018), (214), (300), (208), (119), and (217), respectively. These peaks coincide with the simulated diffraction peaks and are all in good agreement with JCPDS number 33-066428.

XRD pattern of α-Fe2O3 NRs obtained from the experiment (red line) and from the simulation (blue line)
The optical properties of α-FeO are illustrated in Figure 3, whichshows the light absorption of our sample in the wavelength range from 380 nm to 1000 nm. Clearly, the absorption peak is found ca. 400 nm (Figure 3a). A further analysis using Tauc's plot (Figure 3b) revealed that the optical bandgap of our iron oxide material was approximately 2.2 eV, which is similar to the band gap values of α-FeO in other reports29. Additionally, the bandgap energy (E) is calculated to be approximately 2.2 eV using the Kubelka–Munk equation30:
where A is a constant, hv is the intensity of the incident light, α is the absorption coefficient, and n is 1/2 for the indirect bandgap and 2 for the direct bandgap.

a) UV-Vis absorption spectrum was recorded from the wavelength of 350 to 1000 nm and b) The optical bangapd of the α-Fe2O3 NRs was caculated from Tauc method
Figure 4a-c displays SEM images of α-FeO nanorods synthesized at different hydrothermal times (3 h, 4 h, and 5 h). At a hydrothermal duration of 3 hours, the nanorods are still in the early stages of development, exhibiting a fragmented distribution. Conversely, the samples treated for 4 and 5 hours had nanorods with consistent density and well-defined structures. However, considering the time and energy efficiency, the 4-hour hydrothermal sample was selected as the most suitable sample for further investigation. Subsequently, SEM analysis at a scale of 1 μm (Figure 4d) revealed uniform growth of nanorods across a substantial area. Additionally, EDX analysis (Figure 4e) detected Fe, O, Si, and C elements without any presence of any foreign elements, further confirming the high purity of the synthesized sample.

SEM images of α-Fe2O3 NRs at different hydrothermal times: a) 3 h, b) 4 h, and c) 5 h. d) Large-scale SEM image and e) EDX spectrum of the α-Fe2O3 NRs sample after 4 h of hydrothermal treatment.
Figure 5 shows the Raman spectrum of the α-FeO nanorods. Apart from the characteristic peak of the silicon substrate at 521 cm, the remaining peaks are indicative of the hematite structure31, 32. Specifically, the peaks at 224 and 475 cm are assigned to the A vibrational mode, while the five peaks at approximately 244, 291, 408, 609, and 814 cm are attributed to the E mode.

Raman spectrum of the α-Fe2O3 NRs under excited laser with the wavelength of 532 nm
Figure 6a and Figure 6b depict the absorption spectra of the MB solution in the absence and presence of α-FeO NRs under visible light, respectively. Throughout the dark stirring process, the maximum absorption intensity of the MB solution containing the α-FeO NRs gradually decreased, indicating that MB adsorbed onto the stable material surface. Upon illumination, the intensity of the absorption peak of the MB solution with the α-FeO NRs catalyst decreased more rapidly over time than that of the solution without the catalyst. This observation proves that the α-FeO NRs material exhibits photocatalytic activity in the visible light region. Hence, to further assess the photocatalytic performance, the degradation efficiency and reaction rate constant of MB by the α-FeO NRs were calculated (Figure 7).

(a) The absorption spectra of methylene blue (MB) without and b) with α-Fe2O3 NRs under dark and light conditions

(a) Degradation curve of the MB solution under dark and visible light conditions. (b) The reaction kinetics constant of MB with and without α-Fe2O3 NRs.
DISCUSSION
The VESTA simulation findings for the crystal structure of α-FeO (Figure 1) reveal that the hematite structure is based on the arrangement of O anions, which form a hexagonal close-packed (HCP) lattice along the [001] direction of the Fe cations. One iron atom and six oxygen atoms form an octahedral unit, with each octahedral unit sharing edges with three neighboring octahedra in the same plane. Consequently, the octahedral units undergo distortion, resulting in two different bond lengths of Fe–O, measured at 1.98 Å and 2.09 Å33. In the XRD pattern (Figure 2), the experimentally synthesized sample exhibits the presence of 14 characteristic diffraction peaks of α-FeO without any additional peaks, indicating the high purity of the sample obtained through the hydrothermal method in this study. This finding contributes to demonstrating the successful attainment of the α phase of FeO with the depicted crystal structure. Additionally, the fundamental parameters of the diffraction peaks obtained from the simulation are clearly depicted in
% dye degradation= [(C-C)/C] × 100% (1)
The photodegradation of these nanomaterials was also quantitatively described using the pseudo-first-order kinetic equation, which is the most common rate law and was adopted as follows13:
ln(C/C) = -kt (2)
where C and C are the initial dye concentration and dye concentration at time ‘t’, respectively.
The results indicate that in the absence of a catalyst, the self-degradation capacity of MB (2.5 ppm) is only approximately 10%. With the α-FeO NRs catalyst in the MB sample, after adsorption-desorption equilibrium, the MB concentration decreased to 78% of the initial concentration. This reduction corresponds to the removal of approximately 22% of MB due to its absorption onto the material's surface. After 8 h of the photocatalytic reaction, the MB concentration decreased further to 45%, indicating an additional 33% removal through the photocatalytic process. These results demonstrate that 55% of the α-FeO NRs were removedin this study. Furthermore, the reaction rate constant of the MB solution in the presence of the α-FeO NRs catalyst is -0.07008, approximately 7.2 times greater than the rate constant of MB without α-FeO NRs, which is -0.00972. Although the photocatalytic efficiency of α-FeO NRs is not yet high, this material has potential due to the simplicity of the fabrication process and sample recovery after the catalytic reaction.
Basic parameters of the diffraction peaks of α-Fe2O3
|
h |
k |
l |
2θ |
d (Å) |
h |
k |
l |
2θ |
d (Å) |
|
0 |
1 |
2 |
23.942 |
3.7137 |
2 |
1 |
10 |
93.019 |
1.0618 |
|
1 |
0 |
4 |
32.976 |
2.7141 |
4 |
0 |
4 |
94.388 |
1.0499 |
|
1 |
1 |
0 |
35.223 |
2.546 |
1 |
1 |
12 |
94.805 |
1.0464 |
|
0 |
0 |
6 |
39.21 |
2.2957 |
1 |
3 |
7 |
95.73 |
1.0387 |
|
1 |
1 |
3 |
40.481 |
2.2266 |
3 |
2 |
1 |
99.542 |
1.0089 |
|
2 |
0 |
2 |
43.04 |
2.0999 |
1 |
2 |
11 |
100.6 |
1.0011 |
|
0 |
2 |
4 |
49.019 |
1.8569 |
2 |
3 |
2 |
100.63 |
1.0009 |
|
1 |
1 |
6 |
53.719 |
1.7049 |
3 |
1 |
8 |
101.17 |
0.9971 |
|
2 |
1 |
1 |
55.49 |
1.6546 |
2 |
2 |
9 |
103.83 |
0.9787 |
|
1 |
2 |
2 |
56.784 |
1.62 |
3 |
2 |
4 |
105.05 |
0.9706 |
|
0 |
1 |
8 |
57.407 |
1.6039 |
4 |
1 |
0 |
106.35 |
0.9623 |
|
2 |
1 |
4 |
61.788 |
1.5002 |
0 |
1 |
14 |
106.68 |
0.9603 |
|
3 |
0 |
0 |
63.208 |
1.4699 |
2 |
3 |
5 |
108.41 |
0.9497 |
|
1 |
2 |
5 |
65.39 |
1.426 |
1 |
4 |
3 |
109.75 |
0.9418 |
|
2 |
0 |
8 |
69.17 |
1.357 |
4 |
1 |
3 |
109.75 |
0.9418 |
|
1 |
0 |
10 |
71.73 |
1.3148 |
0 |
4 |
8 |
112.13 |
0.9284 |
|
1 |
1 |
9 |
71.923 |
1.3117 |
1 |
3 |
10 |
114.76 |
0.9146 |
|
2 |
2 |
0 |
74.474 |
1.273 |
3 |
0 |
12 |
116.74 |
0.9047 |
|
2 |
1 |
7 |
74.554 |
1.2718 |
0 |
3 |
12 |
116.74 |
0.9047 |
|
3 |
0 |
6 |
76.963 |
1.2379 |
3 |
2 |
7 |
117.77 |
0.8997 |
|
0 |
3 |
6 |
76.963 |
1.2379 |
2 |
0 |
14 |
118.04 |
0.8985 |
|
2 |
2 |
3 |
77.797 |
1.2267 |
2 |
1 |
13 |
118.96 |
0.8942 |
|
1 |
3 |
1 |
78.44 |
1.2182 |
4 |
1 |
6 |
120.45 |
0.8875 |
|
3 |
1 |
2 |
79.536 |
1.2042 |
1 |
4 |
6 |
120.45 |
0.8875 |
|
1 |
2 |
8 |
80.066 |
1.1975 |
3 |
1 |
11 |
123.38 |
0.8749 |
|
0 |
2 |
10 |
82.506 |
1.1682 |
5 |
0 |
2 |
123.42 |
0.8748 |
|
1 |
3 |
4 |
83.882 |
1.1525 |
2 |
3 |
8 |
124.04 |
0.8722 |
|
0 |
0 |
12 |
84.3 |
1.1479 |
1 |
1 |
15 |
126.18 |
0.8638 |
|
3 |
1 |
5 |
87.118 |
1.1178 |
4 |
0 |
10 |
127.01 |
0.8607 |
|
2 |
2 |
6 |
87.564 |
1.1133 |
0 |
5 |
4 |
128.74 |
0.8544 |
|
0 |
4 |
2 |
90.083 |
1.0886 |
CONCLUSIONS
In summary, we have successfully synthesized α-FeO nanorods through a simple, rapid, and cost-effective process, yielding promising results. Specifically, nanorods withaverage lengths and diameters of 415 nm and 110 nm, respectively, were grown at a uniform density. Furthermore, the synthesized nanorods exhibited an E of 2.2 eV and demonstrated a 55%degradation efficiency of MB throughout the entire process. Additionally, through a combination of experimental and simulation approaches, it has been confirmed that these α-FeO nanorods possess a rhombohedral crystal structure and belong to the space group . With this characterization, we hope to provide valuable insights to facilitate further research endeavors based on α-FeO nanorods, thereby expanding the potential applications of this material in the future.
COMPETING INTERESTS
The authors declare that there are no conflicts of interest related to the publication of this article.
AUTHORS’ CONTRIBUTIONS
H. N. Luong: carried out the experiment, writing manuscript. H. N. Luong, L. T. Duy: measured and analyzed XRD data based on experiments and simulations. L. N. T. Nguyen, C. K. Tran: measured, analyzed SEM and UV-Vis data. H. N. Luong, T. M. Dinh, N. D. N. Huynh: investigated the material's capacity for degrading MB via the photocatalytic process.. V. Q. Dang: managed the experiment, collected data to write the paper.
ACKNOWLEDGMENTS
This research is funded by Vietnam National Foundation for Science and Technology Development (NAFOSTED) under grant number 103.03-2021.59.