

Evaluation of the forming quality of Inconel 625 thin-walled parts manufactured via cold metal transfer additive manufacturing
- Advanced Technology Center, Le Quy Don Technical University
- Mechanical Electrical Engineering 151, VN
- ATC, Le Quy Don Technical University, 236 Hoang Quoc Viet, Bac Tu Liem, Hanoi
- ATC, Le Quy Don Technical University
Abstract
Introduction: Wire arc additive manufacturing (WAAM) is a metal additive manufacturing technique that uses an arc source to melt metallic wires, depositing molten metal layer by layer to form parts. Controlling the forming quality of parts in the WAAM process poses significant challenges. This study evaluated the shape quality of thin walls produced via WAAM using Inconel 625 alloy. Additionally, the impacts of the welding speed (v) and linear heat input (LHI) on the geometric quality of the fabricated components are investigated.
Methods: A cold metal transfer (CMT)-WAAM system was employed to construct thin-walled samples on low-carbon substrates. Three samples were fabricated at three different welding speeds (v = 35, 50, and 65 cm/min), while the other parameters remained constant. The samples were scanned via a Kreon Zypher II scanner, and their geometric properties, including average layer height (ALH), total wall width (TW), effective wall width (EW), and material deposition efficiency (DE), were measured via Geomagic Design X and AutoCAD software. Surface roughness parameters (e.g., Sz, Sa, and Sq) were assessed via Omnisurf 3D software.
Results and Discussion: Increasing the welding speed from 35 to 65 cm/min led to reductions in all measured characteristics - ALH, TW, EW, and DE. For example, ALH decreases from 2.63 mm to 1.87 mm, TW decreases from 9.39 mm to 6.83 mm, and EW decreases from 5.90 mm to 4.30 mm. An increase in the LHI from 19.08 to 35.22 J/mm tends to inversely affect these geometric characteristics. Additionally, as v or LHI increases, Sz, Sa, and Sq initially decrease to a certain level before rising again.
Conclusions: The results obtained from this study offer valuable insights into the relationship between processing and forming quality in the CMT-WAAM process for Inconel 625 thin-wall components. These insights provide a foundation for selecting optimal process parameters and providing informed recommendations for the CMT-WAAM process of Inconel 625 alloys.
INTRODUCTION
WAAM technology is a 3D printing technology that uses a metal welding wire as the input material 1, 2, 3. The arc energy sources used in the WAAM process can include gas metal arc welding (GMAW or MIG), cold metal transfer (CMT), gas tungsten arc welding (GTAW or TIG), and plasma arc welding (PAW)4. Compared with other additive manufacturing (AM) technologies that use laser or electron beam sources and metal powder (e.g., from 0.1 to 0.6 kg/h), WAAM has a superior material deposition rate (from 3 to 8 kg/h)5, 6. Moreover, requirements for the environment are not too strict, making this technology capable of manufacturing large parts. The WAAM system also has lower investmentcosts7. Currently, WAAM plays a very important role in many fields, such as the aerospace, construction, structural, nuclear energy, and marine industries8, 9, 10, 11, 12, 13.
Many studies on the WAAM process for various alloys (e.g., steels, aluminum, titanium, and nickel-based alloys) have been reported in the literature. These studies have focused mostly on the effects of WAAM parameters on microstructures and mechanical properties14, 15, 16, 17. However, research evaluating the influence of process parameters on the geometric shape and surface roughness of a product is limited to only certain types of materials, such as stainless steel and low-carbon steel. For example, Dinovitzer et al. 18 reported that when the welding speed increased, the surface roughness increased, and an inverse relationship was observed between the current applied during the WAAM process of the HASTELLOY X alloy. Xiong et al.19 provided a quantitative evaluation approach for the surface roughness of thin-walled parts.
Inconel 625 is known as a nickel-based superalloy with high strength and good heat, corrosion, and oxidation resistance. This alloy has a high bearing capacity and a wide temperature range, from cryogenic temperatures to 982°C 14, 15. Several studies have been published on the microstructures, mechanical properties, corrosion resistance, residual stress, and defects of WAAMed Inconel 625 parts. Xu et al. 20 investigated the microstructures and mechanical properties of Inconel 625 parts fabricated by PAW-WAAMed with a continuous deposition strategy (CDS) and an interpass cooling strategy (ICS). They reported that the fabricated parts revealed columnar dendrite structures decorated with a large amount of Laves phase (MC carbides and Ni3Nb), and ICS improved the mechanical properties and surface quality compared with those of CDS. Cheepu et al. 21 examined the effects of different deposition strategies for Inconel 625 alloys via super-TIG-WAAM. They reported that multi-pass beads with stringer and zigzag layering strategies could refine microstructures. Recently, Kumar et al. 22 performed a parametric study and optimization of weld beads in GMAW-WAAM of Inconel 625 via the RSM and DA methods. Motwani et al. 23 presented a study on multi-response optimization in CMT-WAAM of Inconel 625 via entropy weightage-assisted gray-based Taguchi analysis.
Until recently, the influence of process parameters on the geometric characteristics of Inconel 625 products built via WAAM has rarely been reported. Therefore, this work aims to analyze the geometric characteristics of Inconel 625 thin-walled parts produced via CMT-WAAM technology and examine the effects of the welding speed (v) and linear heat input (LHI) on the part-forming quality. LHI refers to the amount of heat applied per unit length of weld track. In WAAM, LHI is the parameter with the greatest impact on the cooling rate that drives the shaping quality, microstructures, and mechanical properties, whereas v is strongly related to the part geometry and productivity. In the present study, we aimed to evaluate the geometric characteristics of the as-built part, including the average layer height (ALH), total width (TW), effective width (EW), and surface roughness of the thin-walled parts and the deposition efficiency (DE), and the effects of v and LHI on these characteristics. The outcomes enable us to discuss the actual process parameter selection for manufacturing Inconel 625 components with CMT-WAAM technology.
The structure of this article is as follows: The materials and experimental procedures are described in section 2. The primary findings regarding the geometric properties and surface roughness of the building materials are provided in the Results and Discussion section. The last section, conclusions, provides an overview of significant findings and suggestions for the future.
MATERIALS AND METHODS
Materials
In this research, DAIKO SF 625 welding wire, which has a broad operating temperature range from -269°C to 1000°C, was used. Its diameter is 1.2 mm, and the chemical composition of the wire is presented in
Chemical composition of the welding wire (in wt.%)
|
C |
Mn |
Si |
S |
P |
Cr |
Ni |
Mo |
Nb+Ta |
Cu |
Al |
Ti |
Fe |
|
0.02 |
0.02 |
0.1 |
0.005 |
0.005 |
22 |
65 |
9 |
3.5 |
0.05 |
0.2 |
0.2 |
<0.5 |
The material used in the experimental process was S45C (JIS G4051) steel. The chemical composition of the substrate included 0.48 C, 0.35 Si, 0.9 Mn, 0.03 P, 0.035 S, 0.2 Ni, 0.2 Cr, and 0.3 Cu (in wt.%). Its dimensions are 200 mm × 200 mm × 10 mm in length, width, and height, respectively. On the other hand, the plate was cleaned before the experiment.
CMT-WAAM system
All the samples were fabricated on the CMT-WAAM system, as shown in Figure 1. It consists of a CMT welding unit (TPS 320i) and a 6-axis robot (FD-V8 OTC Daihen). During welding, the motion of the welding wire is regulated with an average frequency of approximately 70 Hz24, 25, 26, 27, and the power source is supplied intermittently during each short-circuit period to create the arc and melt the metal wire. As a result, molten metal droplets were steadily controlled into the welding pool.

CMT-WAAM system used for building thin-walled parts
With the CMT welding principle, the welding wire is first moved closer to the substrate to start the welding process. An arc is formed, and the welding head is controlled to process the molten metal into the welding pool by moving the welding wire closer and farther away to minimize the thermal effect in the welding area. At the end of a welding line, the process is repeated. The weld beads are built on each other until the part is completed.
Building thin-walled samples and data collection methods
In this study, three rectangular thin-walled samples were subjected to three different welding speeds (v = 65, 50, and 35 cm/min), and the wire feed speed (WFS) was held constant at 6.5 m/min, as shown in
where η is the energy conversion efficiency (normally, η = 85% for CMT), and U and I are the voltage and current, respectively. With the CMT power source, U and I were automatically set according to the value of the wire feed speed, as shown in
Setup input and actual process parameters
|
No. |
Number of layers |
Target |
Actual | |||
|
WFS (m/min) |
v (cm/min) |
I (A) |
U (V) |
LHI (J/mm) | ||
|
1 |
20 |
6.5 |
65 |
160 |
15.2 |
191 |
|
2 |
20 |
6.5 |
50 |
157 |
15.3 |
245 |
|
3 |
20 |
6.5 |
35 |
158 |
15.3 |
352 |
The thin-walled samples were made of 20 layers, and the programmed dimension of each layer was the same, with dimensions of 130 mm in length and 60 mm in width. The starting point, the ending point, and the transfer point between the layers are the same and are in the middle of the length dimension. During the deposition process, the arc was emitted continuously according to the CMT principle. Moreover, commercially pure argon was used (99.99% Ar) with a flow rate of 16 L.min to protect the welding pool. All the samples were fabricated at room temperature. The distance between the torch tip and the workpiece surface was fixed at 10 mm. The angle between the axis of the welding torch and the substrate was also maintained at 90 degrees.
After fabrication, all the samples were scanned by a Kreon Zypher II scanner to collect their actual shape. The scanned data were then processed with Geomagic Design X software, as shown in Figure 2.

3D scanned data of the samples
In this study, the geometric characteristics of the thin walls investigated are illustrated in Figure 3, including the total width (TW), the effective width (EW), the total height (TH), and the effective wall height (EH). The average layer height (ALH) is determined by the ratio between TH and the number of printed layers.

Illustrations of the wall’s geometric characteristics
The method used to analyze the geometrical characteristics is presented in Figure 4. Each thin-walled sample was evaluated at four cross-sections (cs1, cs2, cs3, and cs4). The distance between two adjacent cross-sections is 25 mm. cs1 and cs2 are symmetrical with respect to cs4 and cs3, respectively, through the center plane along the length of the scanned sample. This ensures the survey along the entire length of the deposition path and monitoring the difference in profile at the beginning and end of the deposition line. These intersection profiles were processed in AutoCAD software to measure ALH, TW, EW, and DE.

Process of collecting geometric characteristics (dimensions in mm)
The material deposition efficiency (DE) is a value that represents the efficiency of the entire WAAM process in general. It is determined by the ratio of the effective cross-sectional area to the total cross-sectional area at the local location under consideration, as described in Eq. (2), where the effective cross-sectional area is calculated via the values of effective width (EW) and effective height (EH).
The process for evaluating the surface roughness parameters is shown in Figure 5. For each sample, two portions of the opposite surface on each wall along the length of the sample were cut. Each portion has the same dimensions of 70 mm × 30 mm. These four surface samples were subsequently used to analyze the surface roughness parameters via Omnisurf 3D software. The studied roughness parameters are the maximum roughness S, average roughness S, and mean square roughness S, which are calculated via Eqs. (3), (4), and (5), respectively.
where z(x,y) represents the coordinates of the grid points and represents the surface area.

Process of determining the surface roughness
RESULTS
Geometric characteristics
The results regarding the geometric characteristics (including TW, TH, EW, EH, and ALH) of the thin-wall samples fabricated via CMT-WAAM are displayed in
Obtained geometric parameters
|
Sample |
Cross section |
Obtained data | |||
|
TW (mm) |
TH (mm) |
EW (mm) |
EH (mm) | ||
|
No.1 |
cs1 |
6.87 |
36.49 |
4.39 |
35.05 |
|
7.2 |
37.25 |
4.42 |
35.25 | ||
|
cs2 |
6.58 |
36.89 |
4.37 |
35.51 | |
|
6.97 |
38.47 |
4.06 |
37.03 | ||
|
cs3 |
6.79 |
37.18 |
4.22 |
35.64 | |
|
6.81 |
38.04 |
3.98 |
36.74 | ||
|
cs4 |
6.7 |
36.83 |
4.67 |
35.03 | |
|
6.75 |
37.26 |
4.31 |
35.79 | ||
|
Average |
6.83 |
37.30 |
4.30 |
35.76 | |
|
Standard deviation |
± 0.19 |
± 0.65 |
± 0.22 |
± 0.75 | |
|
No. 2 |
cs1 |
8.06 |
41.13 |
5.22 |
39.28 |
|
7,67 |
40.95 |
4.81 |
39.09 | ||
|
cs2 |
7.99 |
41.18 |
5.27 |
39.94 | |
|
7.94 |
41.34 |
4.98 |
40.37 | ||
|
cs3 |
8.43 |
40.48 |
5.52 |
38.45 | |
|
7.90 |
40.67 |
4.54 |
38.68 | ||
|
cs4 |
8.18 |
40.76 |
5.34 |
39.13 | |
|
7.86 |
40.89 |
4.64 |
39.18 | ||
|
Average |
8.00 |
40.93 |
5.04 |
39.27 | |
|
Standard deviation |
± 0.23 |
± 0.29 |
± 0.35 |
± 0.63 | |
|
No. 3 |
cs1 |
9.32 |
52.57 |
5.62 |
51.7 |
|
9.98 |
51.86 |
5.82 |
50.77 | ||
|
cs2 |
9.04 |
52.54 |
6.02 |
51.19 | |
|
9.51 |
52.27 |
5.78 |
50.95 | ||
|
cs3 |
9.24 |
52.76 |
6.15 |
51.51 | |
|
9.6 |
52.79 |
5.89 |
51.42 | ||
|
cs4 |
9.22 |
52.73 |
5.56 |
51.49 | |
|
9.21 |
52.6 |
6.33 |
51.19 | ||
|
Average |
9.39 |
52.52 |
5.90 |
51.28 | |
|
Standard deviation |
± 0.30 |
± 0.31 |
± 0.26 |
± 0.31 | |
Average height value of each layer (ALH)
|
Sample |
v (cm/ph) |
TH (mm) |
Number of layers |
ALH (mm) |
|
No. 1 |
65 |
37.30 |
20 |
1.87 |
|
No. 2 |
50 |
40.93 |
20 |
2.05 |
|
No. 3 |
35 |
52.52 |
20 |
2.63 |
The graphs that depict the influence of the welding speed v on ALH, TW, and EW are presented in Figure 6. The ALH decreases proportionally with the welding speed v. The ALH decreases from 2.63 mm to 1.83 mm when v increases from 35 cm/min to 65 cm/min. ALH tends to decrease rapidly at lower speeds (from 35 to 50 cm/min), whereas it slowly decreases at high values of v, from 50 to 65 cm/min (Figure 6a).

The influence of
Figure 6b shows that both the values of TW and EW gradually decrease with increasing v. Specifically, the overall width of the wall (TW) is 9.39 mm, 8.00 mm, and 6.83 mm when v is set at 35, 50, and 65 cm/min, respectively. The effective width of each sample (EW) is also proportional to the overall thickness, and its values are 5.9 mm 5.04 mm and 4.3 mm at v = (35, 50, and 65) cm/min, respectively.
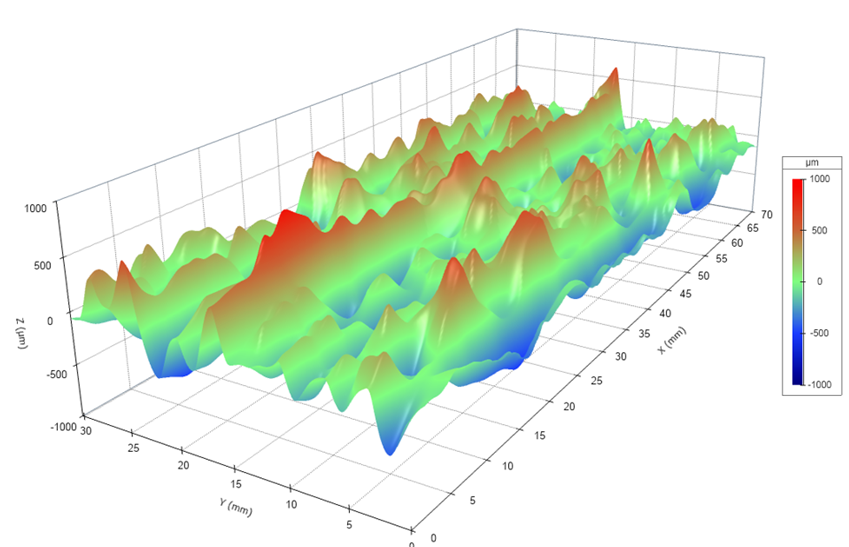
Figure 7 illustrates the four surface portions of the thin-walled sample “No. 1” that were extracted from the 3D scanned data through the procedure in Figure 5. These representative surfaces were used to measure surface roughness parameters (S, S, and S) via Omnisurf 3D software. Figure 8 shows the morphology characterization of the surface portion in Figure 7.

The surface portions of sample No. 1

An example of the surface morphology observed in Omnisurf 3D
The surface roughness parameters of all the samples are shown in
Surface roughness parameters measured via Omnisurf 3D software
|
Sample |
Number of measurements |
Sz (µm) |
Sa (µm) |
Sq (µm) |
|
No. 1 |
1 |
96.05 |
5.29 |
7.76 |
|
2 |
129.18 |
5.41 |
8.20 | |
|
3 |
156.06 |
5.04 |
7.81 | |
|
4 |
133.96 |
5.84 |
8.70 | |
|
Average |
128.811 |
5.394 |
8.115 | |
|
Standard deviation |
± 24.783 |
± 0.336 |
± 0.434 | |
|
No. 2 |
1 |
124.912 |
4.019 |
6.106 |
|
2 |
122.316 |
4.257 |
6.586 | |
|
3 |
89.041 |
4.285 |
6.319 | |
|
4 |
97.586 |
4.741 |
7.166 | |
|
Average |
108.464 |
4.326 |
6.544 | |
|
Standard deviation |
± 17.870 |
± 0.302 |
0.459 | |
|
No. 3 |
1 |
194.657 |
6.235 |
9.6 |
|
2 |
169.984 |
5.775 |
8.565 | |
|
3 |
157.580 |
5.562 |
8.792 | |
|
4 |
153.649 |
6.034 |
9.064 | |
|
Average |
168.968 |
5.902 |
9.005 | |
|
Standard deviation |
18.487 |
0.294 |
0.446 |
The maximum roughness S value decreases from 168.968 µm to 108.464 µm when v increases from 35 to 50 cm/min, respectively. When v increases from 50 to 65 cm/min, S tends to increase from 108.464 µm to 128.811 µm. Similarly, the average roughness S and the mean square roughness S have similar trends. For example, S decreases from 5.902 µm to 4.326 µm when v increases from 35 cm/min to 50 cm/min, whereas it increases from 4.326 µm to 5.394 µm as v increases from 50 cm/min to 65 cm/min. S decreases from 9.005 µm to 6.544 µm when v increases from 35 cm/min to 50 cm/min, and it increases from 6.544 µm to 8.115 µm as v increases from 50 cm/min to 65 cm/min.

Influence of

Influence of
DISCUSSION
Effects of LHI on ALH, TW, and EW
As mentioned previously, the linear heat input (LHI) plays a crucial role in determining the dimensions and properties of the deposited layers. When the LHI increases, a greater amount of energy is applied to melt the filler wire and the base metal, resulting in larger melting pool dimensions and deeper penetration into the base material. Consequently, increasing LHI tends to result in thicker layers and increased ALH (Figure 11a). Similarly, TW and EW increase with increasing LHI (Figure 11b).

Influence of LHI on (a) ALH and (b) TW and EW
The effect trend of LHI on ALH, TW, and EW is opposite to that of v. Figure 6 shows that all the ALH, TW, and EW values decrease with increasing v. This can be explained by the nature of the process parameters. v indicates the rate at which the amount of molten material is deposited into a welding line, whereas LHI refers to the amount of heat applied per unit length of deposition. As indicated in Eq. (1), the LHI is high at a low value of v28, 29. At a fixed value of WFS, when the LHI increases (or v decreases), the ability to melt the metal wire is greater, more material is melted and added to the weld pool, and the solidification process also takes longer 19. Therefore, the melting pool and weld bead become increasingly larger. This is why all the characteristics ALH, TW, and EW increase (Figure 11).
Effects of LHI on surface roughness
The influence of LHI on surface roughness parameters is similar to the influence of v, meaning that they decrease when the LHI increases from 191 to 245 J/mm and increase again when the LHI increases from 245 to 352 J/mm (Figure 12). The reason is that when WFS is maintained, increasing v reduces the WFS/v ratio, and the staircase effect between layers decreases, leading to a decrease in surface roughness, and the surface quality gradually stabilizes. When v is too low, the amount of heat in the weld pool is large, and the cooling rate is low. After deposition, the surface unevenness and surface roughness are high. As v increases, this heat buildup decreases, the material melts and solidifies more stably, the surface roughness becomes more uniform, and the values decrease19. However, if v continues to increase, the stability of the arc gradually deteriorates. This adversely affects the surface roughness. As a result, the surface roughness increases, and the surface quality deteriorates.

Influence of
CONCLUSIONS
This study investigated the influence of various process parameters, specifically the welding speed v and linear heat input LHI, on the geometric characteristics and material deposition efficiency of the WAAM process for Inconel 625 alloys. The main conclusions are expressed as follows:
• As the welding speed v increases, the LHI and the volume of material added to the melting pool decrease, causing the average layer height, total width, and effective width to decrease.
• The average layer height, total width, and effective width increase when the LHI increases.
• With increasing welding speed v and LHI, the maximum roughness S, average roughness S, and mean square roughness S decrease. They continue to increase as the welding speed v or LHI continues to increase.
The findings of this study provide insight into the effects of process parameters (v and LHI) on the geometric characteristics of as-built parts, which can support the adjustment of the process parameters in the CMT-WAAM process of Inconel 625 alloy to achieve the expected quality. Additionally, the estimated S value can be considered a machining allowance for finishing operations.
In this study, only the effects of the process parameters on the geometric characteristics of the walls were observed. In future works, it will be interesting to develop regression models for all the characteristics with high accuracy. These models can be used to predict the proper parameters and more process parameters to achieve the desired quality. Moreover, it is also important to investigate the microstructures and mechanical properties of the as-built material to confirm its feasibility in real applications.
LIST OF ABBREVIATIONS
GMAW: gas-metal arc welding
AM: Additive Manufacturing
GTAW: gas tungsten arc welding
PAW: Plasma arc welding
MIG: Metal Inerst Gas
TIG: Tungsten Inerts the Gas
CMT: Cold Metal Transfer
LHI: linear heat input
ALH: Averagelayer height
TW: Total width
EW: Effective Width
TH: Total Height
EH: Effective Height
DE: Deposition efficiency
WFS: Wire Feed Speed
ACKNOWLEGEMENTS
This research is funded by the Vietnam National Foundation for Science and Technology Development (NAFOSTED) under grant number 107.99-2023.17.
DATA AVILABILITY
All the data generated or analyzed during this study are included in this published article.
CONFLICT OF INTEREST
The authors declare that they have no competing interests.