

Valuation of provisioning ecosystem services from tram chim national park, Dong Thap province, Vietnam
- Ho Chi Minh City University of Technology (HCMUT), 268 Ly Tuong Kiet street, district 10, Ho Chi Minh city, Viet Nam
- Ho Chi Minh City University of Science (HCMUS), 227 Nguyen Van Cu std., ward 4, district 5, Ho Chi Minh city, Viet Nam
- Tram Chim National Park, Ward 4, Tràm Chim town, Tam Nông district, Đồng Táp province, Viet Nam
Abstract
The final report of the project on the rational use of wetland natural resources in Tram Chim National Park (TCNP) with community participation during the 2012-2016 period has provided many interesting statistical data on the total number of households exploiting resources, average income, total products obtained, types of products, estimated total revenue, etc. However, since the end of the project until now, TCNP has not updated any additional data. This article uses a survey method of farmers combined with a market-based valuation method to determine the types of resources being exploited belonging to 4 groups of provisioning service: food, fuel, medicinal plants, and decorative materials. To assess the value, the article estimates the proportion of households and the average amount of resources exploited from 70 survey questionnaires. Results achieved: (i) Type of resources: there are 11 types of resources being exploited; (ii) Exploitation rate: food - 90% of surveyed households, medicinal plants 5.5%, fuel 3.5%, and decorative materials 1.0%; (iii) Annual exploitation volume: 284.3 tons of food, 2.0 tons of fuel, 1.4 tons of medicinal plants, and 1.2 ton of decorative materials; (iv) The estimated total value is 17.94 billion VND per year, with an average of 18,1 (±2,3) million VND/household/month. The results from the article demonstrate that TCNP is still providing a significant value of resource supply to society.
Introduction
Wetlands are an irreplaceable form of natural capital1, providing high-value ecosystem services that support a wide range of economic production and consumption activities. Wetland ecosystem services (WES) encompass the various goods and services derived from wetlands and semi-wetlands, including marshes, swamps, and tidal flats2, They contribute directly and indirectly to human welfare3. WES can be divided into four categories: (i) Provisioning services, providing direct-use resources, such as shrimp, fish, vegetables, medicine; (ii) Regulating services, helping reduce the impact of natural disasters, replenishing groundwater, and storing carbon through biomass (iii) Cultural services, providing resources for tourism, entertainment, aesthetics, and education activities; and (iv) Supporting services, which are the essential ecological functions that support ecosystem processes4. WES are inherently spatially heterogeneous in nature5. In some cases, the loss of these services is irreversible6, leading to irreparable environmental damage and associated negative impacts on human welfare.
The depletion and degradation of wetlands due to overuse are occurring rapidly on a global scale, reducing both the number and quality of WES. For example, 35% of global wetlands were lost from 1970 to 20157, which has had a profound impact on human welfare. Therefore, wetlands need to be used strategically8 to generate a more sustainable income stream. However, the value of WES and the changes in that value over time must be systematically and scientifically assessed.
Tram Chim National Park (TCNP) is one of the last remnants of the Dong Thap Muoi wetland ecosystem9. TCNP’s landscape largely depends on hydrology and soil type (Shepherd, 2008). The differences in composition and structure of plant communities among the wetlands contribute to the richness of ecological functions and biodiversity of TCNP, thereby providing a variety of valuable ecological goods and services10, 11.
In their final report on the pilot co-management of natural resources in TCNP in 200912, the management board presented statistics on the quantity of some of the products harvested within TCNP, such as fish, grazing grass, vegetables, snails, and firewood. In 2016, authors Tran Triet and Jeb Barzen noted that the most ‘desirable’ resource in TCNP for the buffer zone residents was fish. The local community also exploited other resources, such as turtles, snakes, birds, lotus, and water lilies for food. Additionally, some types of grass, such as ginger grass or nan grass, were harvested by local vegetable growers as covering material13. The final report of the project on the sustainable use of wetland resources in TCNP conducted during the period 2012–201614 and incorporating community participation, outlined the following: (i) employment of 300–350 households in the buffer zone, with an average income of 1.5–2.0 million VND/household/month; (ii) authorized utilization of resources included aquaculture, vegetables, grass, snails, melaleuca firewood, permitted exploitation period spanned four months annually, from September to December; (iii) the total revenue generated by the project was approximately 1.740 billion VND. Consequently, the 2016 data from this study were the most recent available statistics on resource usage in TCNP. According to clause 3, article 5 of Resolution No. 04/2024/NQ-HDTP of the Supreme People’s Court Council15 , national parks are areas where fishing is prohibited under point b, clause 1 of article 242 of the Criminal Code. Therefore, it is necessary to conduct a study on the current state of resource exploitation inside TCNP to provide data to support management decisions.
Materials and Methods
Study site
The TCNP buffer zone is located within the administrative boundaries of five communes and one town (Phu Tho, Phu Hiep, Phu Thanh B, Phu Duc, and Tan Cong Sinh). The population of the buffer zone in 2022 was 3,429 households with 46,762 people, accounting for approximately 46.7% of the total district population. Tram Chim town and Phu Tho commune have the highest population of the communities considered in the buffer zone. The buffer zone contains 247 households classified as living below the poverty line and 119 considered near-poor (i.e., just above the poverty threshold), together accounting for 10.7% of all households, which is substantially higher than the district average of 2.26%16. The primary economic activities of the communes in the buffer zone are agriculture, including sectors such as rice cultivation, horticulture, livestock, and aquaculture. Additionally, the citizens in the buffer zone engage in traditional crafts (for example, plastic chair weaving, water hyacinth weaving, drying, incense making) and work as hired labor for agricultural production (for example, rice planting, weeding, spraying, fertilizing).
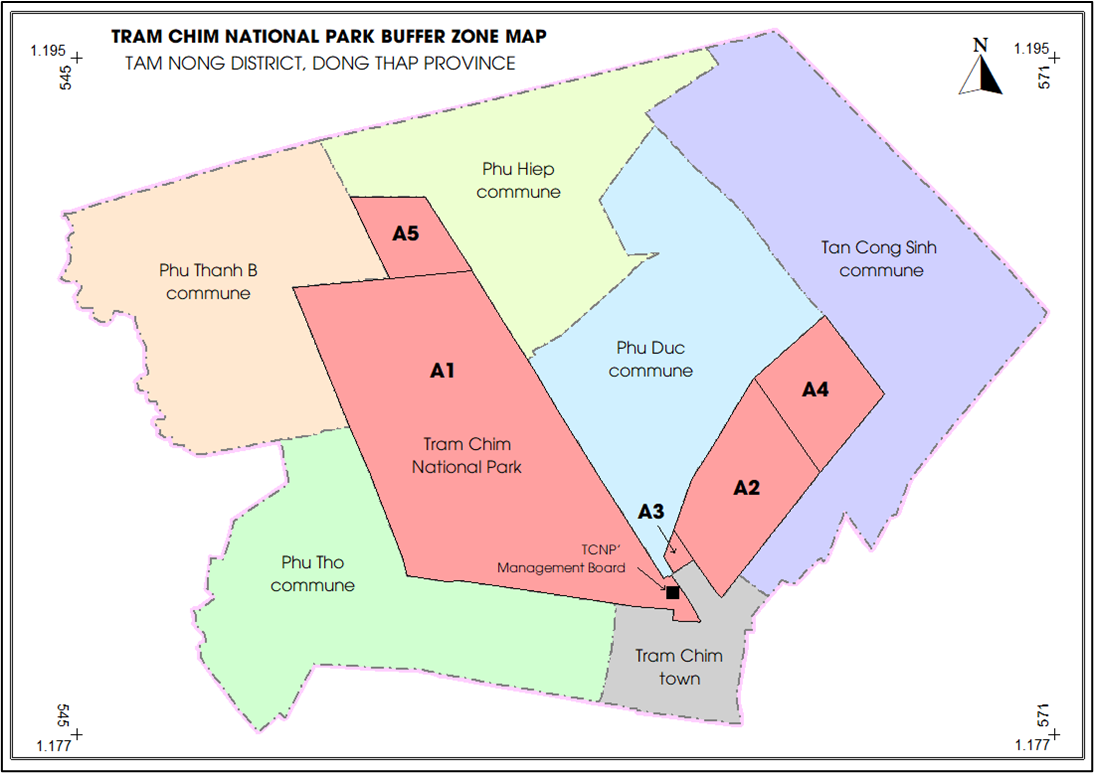
Administrative map of the buffer zone of Tram Chim National Park
Data collection
The objective of this study is to provide a statistical description of two primary indicators: (i) the estimated/verified participation rate of households engaged in utilizing resources in TCNP, and (ii) the estimated/verified average monetary value derived by households that utilize resources from TCNP. The primary data used to assess the value of the services provided by TCNP were collected through structured household questionnaires.
Sample size
In light of the objectives above, we calculated the sample size needed according to formulas (1) and (2) below. The data used to calculate the sample size included (i) the total number of households in the buffer zone (3,429)16; (ii) the maximum number of households engaged in utilizing resources in TCNP (350)14, and (iii) the standard deviation of the average monthly income (1.2 million VND/hh/month)14. Based on these data, the optimal sample sizes were n1 = 32 and n2 = 65. Therefore, a sample size of 65 (± 5) was selected for this study.
Where: P: the rate of households exploiting resources according to previous studies.
α: significance level, the article chooses α = 0,05, calculated z = 1,96
d: maximum acceptable error; in this study, d1 = 0.1 (corresponding to a 10% maximum error in the estimated household participation rate).
Where: σ: standard deviation according to previous studies/pilot studies.
d: maximum acceptable error; in this study, d2 = 3.5 million VND/household/year (with a maximum error in the estimated household income of 10,000 VND/day).
Questionnaire
The questionnaire consisted of five key topics within separate sections, with a total of 18 questions: (i) listing of resources and description of extraction methods (four questions); (ii) production volume and purpose of extraction (four questions); (iii) selling price of each resource (three questions); (iv) reserve fluctuations and future plans (two questions); and (v) personal information, such as full name, address, gender, year of birth, education, and family composition. The survey topics were introduced by the resource management staff and local authorities. Information on the selling prices of the resources was collected and subsequently adjusted to reflect current local market prices.
Valuation method
The monetary value of different resources is estimated using the Market Price Method, as applied in previous studies17. In general, the annual income of a household exploiting j resources from the i-th ecosystem service (where food = 1, fuel = 2, medicinal plants = 3, and decorative materials = 4) is calculated using formula (3). For example, if Mr. A’s household extracts fish and vegetables from TCNP, both of which are part of the food provisioning service, then i = 1 and j = 2.
Where: Rij: income from j resources belonging to the i-th ES (m VND/hh/y).
l: number of household members exploiting in the protected area.
k: number of times to the protected area for exploiting each month (times)
t: number of months of utilization in a year (months)
The results obtained from the pricing process are five sets of annual income data corresponding to the provision of food, fuel, medicine, decorative materials, and the total annual household income derived from these services. These results were then statistically described using SPSS software to determine the average value and average level of resource use per household per year.
Data analysis
A descriptive statistical analysis was undertaken to determine the average income of households exploiting each ecosystem service and for the population. The variables used for this analysis are presented in
Variables used in this study
|
Objective |
Variable Name |
Variable Description |
Variable Type |
Data Collection method |
|
Household Participation Rate in Resource Exploitation |
hh_N |
Household code, encoded by the order of the data entry form |
Norminal |
Encryption |
|
pers_EX |
Number of household members involved in extraction activities (person) |
Scale |
Interview | |
|
nots_EX |
Number of extractions per month (times) |
Scale |
Interview | |
|
mth_EX |
Number of months of extraction in a year (months) |
Scale |
Interview | |
|
type_RS |
Type of resource extracted |
Norminal |
Interview | |
|
yield_RS |
Yield in a extraction (kg) |
Scale |
Interview | |
|
fob_RS |
Price at the field (Free on Board) (VND/kg) |
Scale |
Interview Market Survey | |
|
Average Household Income |
food_Y |
Household food yield (kg/year) |
Scale |
Statistical |
|
fuel_Y |
Household fuel yield (kg/year) |
Scale |
Statistical | |
|
medic_Y |
Household medicinal yield (kg/year) |
Scale |
Statistical | |
|
decor_Y |
Household decorative material yield (kg/year) |
Scale |
Statistical | |
|
food_R |
Household income from food (mVND/year) |
Scale |
Statistical | |
|
fuel_R |
Household income from fuel (mVND/year) |
Scale |
Statistical | |
|
medic_R |
Household income from medicinal (mVND/year) |
Scale |
Statistical | |
|
decor_R |
Household income from decorative material (mVND/year) |
Scale |
Statistical | |
|
total_R |
Total household income (mVND/year) |
Scale |
Statistical |
Results and Discussion
Results
Characteristics of resource exploitation activities in TCNP
Notable findings based on the 70 household survey responses included the following: (i) resource exploiters in TCNP range in age from 35 to 75 years old, with 73% under the age of 55; (ii) 78% of respondents have completed primary education, while the remaining 22% have received secondary education; (iii) 48% of households only exploit resources during the 3 months of the flood season, 42% exploit for more than 6 months of the year, of which up to 20% utilize resources year round (the average number of months of exploitation per household is 6.6 months per year); (iv) 44% of households enter TCNP fewer than 10 times, 26.5% enter more than 20 times, with up to 14% entering daily; (v) the surveyed households currently exploit 11 different types of resources in TCNP: various types of freshwater fish; various types of crabs and snails; rice field rats; snakes; eels; various types of vegetables; other types of food crops; grass; melaleuca firewood; medicinal plants; honey; and water hyacinth. Details of the types of resources and the proportion of households engaged in their extraction are presented in
Statistics of resource types being exploited in TCNP in 2024
|
ESs |
No. |
Code |
Description of the resource |
Household exploitation rate |
|
Food |
1 |
TN_CA |
Various types of freshwater fish |
100% |
|
2 |
TN_OC |
Pila conica, apple snails, freshwater crab |
34,4% | |
|
3 |
TN_CHUOT |
Ricefield rats |
9,4% | |
|
4 |
TN_BS |
Snakes, eels |
37,5% | |
|
5 |
TN_RAU |
Lotus, water lily, water spinach, sesbania sesban, amaranth, water mimosa, pickled small leeks |
45,3% | |
|
6 |
TN_KHAC |
Young lotus leaves, broodstock, terrestrial turtles |
4,7% | |
|
Fuel |
7 |
TN_CO |
Water chestnut plant, dry grass |
7,8% |
|
8 |
TN_CUI |
Melaleuca firewood |
1,6% | |
|
Medicinal herbs |
9 |
TN_THUOC |
Creek premna, asiatic pennywort, periwinkle, stinking passion flower |
9,4% |
|
10 |
TN_MAT |
Wild honey |
4,7% | |
|
Decorative materials |
11 |
TN_BEO |
Water hyacinth |
3,1% |
Valuation of ecosystem provisioning services
Household income from the exploitation of various types of resources in TCNP was evaluated using formula (3), then aggregated by type of ecosystem service to estimate household yield and the average income in the survey sample. Finally, we extrapolated to determine the yield and value of ecosystem services for the entire TCNP. The results of these calculations are detailed in
Results of valuation of yield and value of TCNP's provisioning services in 2024
|
No. |
ESs |
Yield |
Income |
hh’ rate |
No of hhs for TCNP * |
Yield for TCNP |
Value for TCNP |
|
(kg/hh/yr) |
(mVND/hh/yr) |
(%) |
(hh) |
(ton/yr) |
(mVND/yr) | ||
|
1 |
Food |
891,35 |
55,45 |
91,14 |
319 |
284,34 |
17.690 |
|
2 |
Fuel |
152,08 |
4,62 |
3,80 |
13 |
1,98 |
60 |
|
3 |
Medicinal |
107,73 |
13,13 |
3,80 |
13 |
1,40 |
170 |
|
4 |
Decorative |
302,00 |
6,04 |
1,3 |
4 |
1,21 |
25 |
|
Total |
132,84 |
350 |
17.945 |
Maximum number of households exploiting resouces reported by TCNP, 201614.
Discussion
We conducted a comparison of the results of this study with the data published by TCNP in 2010 and 2016, as well as Triet & Barzen 2016 12, 13, 14. This comparison included characteristics of resource extraction activities in TCNP, household income from resource extraction, and the results of the valuation of services provided by TCNP. Several differences were noted for several aspects, including types of extracted resources, household income from extraction activities, and the estimated value of ecosystem provisioning services:
The types of resources extracted: this study recorded an additional six types of resources being extracted in TCNP: (i) melaleuca honey, (ii) ricefield rats, (iii) some medicinal plants such as creek premna, asiatic pennywort, periwinkle, stinking passion, (iv) water hyacinth (stem and flower), (v) young lotus leaves, and (vi) broodstock. Among these resources, the largest extraction output is water hyacinth (about 2.7 tons/year), followed by ricefield rats (about 2,1 tons/year) and medicinal plants (about 2.6 tons/year). The remaining resources have a smaller extraction yield.
The time and frequency of extraction: previous documents determined about 4 months (from September to December)14 . However, the results of this study show that the number of households extracting for up to 4 months accounts for 53% and the number of households extracting year-round accounts for 20% of the interviewed households. The average number of months of extraction is 6,6 with an average extraction frequency of 15 times/month.
The types of resources extracted: this study identified six additional types of resources being extracted in TCNP: (i) melaleuca honey, (ii) ricefield rats, (iii) some medicinal plants such as creek premna, asiatic pennywort, periwinkle, and stinking passion, (iv) water hyacinth (stem and flower), (v) young lotus leaves, and (vi) broodstock. Among these resources, the largest extraction output is water hyacinth (approximately 2.7 tons/year), followed by ricefield rats (approximately 2,1 tons/year) and medicinal plants (approximately 2.6 tons/year). The remaining resources have a smaller extraction yield.
The time and frequency of extraction: previous documents considered approximately 4 months (from September to December) of data14. However, the results of this study show that the number of households extracting for up to 4 months accounts for 53% and the number of households extracting over the entire year accounts for 20% of the interviewed households. The average number of months of extraction is 6.6, with an average extraction frequency of 15 times/month.
Extraction output: TCNP records in 200912 reported 15.526 tons of fish, 6.2 tons of vegetables, and 18.6 tons of snails. The reported figures in 2016 were 43.3 tons of aquatic products, 5.0 tons of vegetables, and 1.7 tons of snails14. In contrast, the estimated data from this study show numbers that are 10 times higher than the above statistics. Specifically, 359 tons of fish are harvested, 35 tons of vegetables are produced, and 125 tons of snails are harvested.
The average income of extracting households: the data in 2016 estimated approximately 1.4–2.0 million VND/person/month14, whereas the estimated value from the study is 18 million VND/month. This is approximately nine times higher than the data in 2016. As a result, the estimated value of TCNP’s provisioning services is substantially greater than previously reported.
The results of this study were converted into international dollars per hectare per year (int$/ha/year) to facilitate comparison with findings from other similar studies set in various regions (see
Comparison with other studies
|
No. |
Year |
Country |
Value of provisioning services (int$/ha/y) |
Compare with this paper's result (%) |
Authors |
|
1 |
1991 |
Nigeria |
141,80 |
39,64 |
Barbier, E.B. |
|
2 |
1998 |
Uganda |
336,23 |
231,11 |
Emerton, L., et al. |
|
3 |
1999 |
Mozambique |
28,45 |
-71,98 |
Turpie, J., et al. |
|
4 |
2000 |
Cambodia |
259,03 |
155,09 |
Hap, N., et al. |
|
5 |
2001 |
Botswana |
583,11 |
474,23 |
Seyam, I. M., et al. |
|
6 |
2004 |
Laos |
1.542,77 |
1.419,28 |
Gerrard, P. |
|
7 |
2012 |
Taiwan |
27,05 |
-73,36 |
Chiueh, Y. |
|
8 |
2012 |
Indonesia |
226,45 |
123,00 |
Hanafi, I., et al. |
Conclusions
The goal of this study was to identify the types of resources currently being exploited in TCNP, estimate the annual extraction output, and subsequently estimate the total value that these resources bring to the people in the TCNP buffer zone. The estimated amount represents the value of the provisioning ecosystem services of TCNP. This was achieved by using structured questionnaires to conduct interviews with 70 households currently engaged in resource extraction in TCNP. The most significant findings include: (i) the identification of 11 types of resources currently being exploited, including the addition of 6 new types to the previous TCNP resource list: honey, ricefield rats, medicinal plants, water hyacinth, young lotus leaves, and broodstock; (ii) the identification of the average annual extraction yield, with food accounting for the largest volume at approximately 284 tons/year, representing 98.4% of the total annual output of TCNP; (iii) the average calculated income of households when exploiting resources in TCNP was an estimated 18 million VND/month, nine times higher than the data provided by previous studies; and finally, (iv) the total estimated value of the ecosystem provisioning services of TCNP based on these data was 17,945 million VND/year.
Credit authorship contribution statement
Author 1: Methodology, Funding acquisition. Author 2: Formal analysis. Author 3: Investigation. Author 4: Investigation.
Declaration of competing interest
The authors declare that we have no known competing financial interests or personal relationships that could have appeared to influence the work reported in this paper.