

Development a method to determine Per- and Polyfluoroalkyl substances (PFAS) in total suspended particulate matter (TSP) by UPLC-MS/MS
- Faculty of Environment, University of Science, VNUHCM-University of Science, Vietnam
Abstract
Per- and poly-fluoroalkyl substances (PFAS) are persistent organic pollutants in many industrial and consumer products, such as pesticides, textiles, and food packaging. Although PFAS are widely used, knowledge about their occurrence in ambient particulate matter and the associated health risks remains limited. The objective of this study was to develop a sensitive, accurate, and simple method for analysing 24 PFAS compounds in total suspended particulate matter (TSP) by HPLC-MS/MS. The target compounds included 7 perfluoroalkane sulfonic acids, 11 perfluoroalkyl carboxylic acids, and 6 perfluoroalkyl acid precursors. Various instrumental parameters were optimized, including declustering potential (DP) and collision energy (CE). The ultrasound-assisted extraction conditions for dust-bound PFAS were optimized by varying the volume of methanol (MeOH), extraction time, and temperature. The optimal condition was determined to be extraction with 4 mL of MeOH at 40 °C for 10 minutes, repeated three times. Method validation results demonstrated sub-ng/L limits of quantification (LOQs) ranging from 0.01-0.14 ng/mL, with high recoveries near the LOQs (95.5% to 114.40%) and high repeatability with %RSD values ranging from 0.1% to 12.6%. The analytical procedure was subsequently applied to assess the level of PFAS contamination in TSP samples in Ho Chi Minh City. The results showed that 22 of the 24 targeted PFAS compounds were detected in the TSP samples, highlighting the significant presence of these pollutants in the megacity.
Introduction
Per- and polyfluoroalkyl substances (PFAS), referred to as “forever chemicals,” are a group of contaminants of emerging concern1. PFAS are widely used in consumer products and industrial processes because of their water and oil repellence2, 3, 4. Hence, PFAS are found in a wide range of products, such as non-stick cookware, water-repellent clothing, and fire-fighting foams. The exceptionally strong carbon-fluorine bonds, with bond energies around 466 kJ/mol, are responsible for the remarkable chemical and thermal stability of these compounds5. Thus, PFAS remain in the environment for a long time, raising concerns about their health impacts. Unlike other persistent organic pollutants (POPs) that tend to accumulate in fatty tissues, PFAS are unique because of their ionic and polar properties, allowing them to bind to blood proteins like serum albumin and accumulate in organs such as the liver and gall bladder6. Exposure to PFAS is linked to various health problems in humans, such as a weakened immune system, thyroid disease, hormone disruption, lowered fertility, and even kidney and testicular cancer7. Therefore, developed nations, including Europe, the United States, Australia, and Japan, have established limits on the concentration of some PFAS belonging to the perfluoroalkane sulfonic acid (PFSA) and perfluoroalkyl carboxylic acid (PFCA) groups in soil and drinking water. However, there are currently no specific regulations for PFAS concentrations in atmospheric particulate matter (PM)8.
PM is a mixture of solid and liquid particles of varying sizes, suspended in the atmosphere. Because of its small size, PM can remain in the atmosphere from several hours to days, acting as a carrier for PFAS, allowing these substances to travel long distances and contaminate remote areas9, 10. This situation is concerning because PFAS may be deposited in soil and water far from their sources. PFAS have been found in PM not only in air-polluted areas like wastewater treatment plants, landfills, and fluorinated chemical industrial sites but also in the ocean and agricultural areas11. Enrichment techniques combined with ultra-performance liquid chromatography-tandem mass spectrometry (UPLC-MS/MS) are preferred for quantifying PFAS in PM because of their exceptional selectivity and sensitivity12. One of the earliest methods for extracting PFAS from the PM matrix for targeted analysis involved ultrasonic extraction from glass fiber filters, using methanol (MeOH)1, 6, 11, 13. Solid-phase extraction (SPE) is a commonly used method to clean the extraction solution, offering advantages such as high enrichment efficiency, low solvent consumption, and easier automation compared to traditional liquid-liquid extraction12. The Supelclean ENVI-Carb SPE method has been used in previous studies for the analysis of PFAS in PM samples14, 15. PFAS have been detected in the blood of women in Hanoi at levels comparable to those observed in Osaka, Seoul, and Busan16. Nonetheless, in Vietnam, regulatory limits for PFAS have not been established, and there is limited awareness of the risk they represent. Most research has focused on PFAS in water and marine life, while some studies have reported the presence of PFAS in sediments and breast milk17. Although analytical methods have been developed for detecting PFAS in water3, no studies have focused on analytical techniques for identifying PFAS in PM. The detection of multiple PFAS in PM around the world suggests a potential route of inhalation exposure for humans. This is particularly concerning given the persistence and bioaccumulative nature of many PFAS18. Therefore, this study aimed to develop and optimize a method for determining PFAS total suspended particulate matter (TSP), using UPLC-MS/MS. Various instrumental parameters, including the declustering potential (DP) and collision energy (CE), were optimized. Additionally, ultrasound-assisted extraction conditions for TSP-bound PFAS were refined by varying the MeOH volume, extraction time, and temperature. As a result, we present the first PFAS analytical procedure for PM in Vietnam. The optimized method can be applied to analyze PFAS in PM samples from other regions, providing valuable data to enhance our global understanding of PFAS distribution.
Material and method
Chemicals
Method validation
Optimizing mass spectrometry operating parameters
Manual optimization was performed by injecting 100 µg/L of each PFAS standard solution directly into the mass spectrometer at a 10 µL/min flow rate in the negative electrospray ionization (ESI) mode. Entrance potential (EP) and collision cell exit potential (CXP) values did not affect the signals and were set at ˗10 V3. The optimal DP and CE values yielding the highest sensitivity were determined for each analyte.
Optimizing ultrasonic extraction parameters
To prepare the PFAS-containing samples, 300 μL of a mixed standard solution (20 ng/mL) was spiked onto a 30 cm² pre-baked (400 °C for 8 hours) quartz filter. The spiked filter was then placed into a 50 mL polypropylene centrifuge tube and left to dry for 10 minutes before ultrasonic extraction. The ultrasonic extraction process was optimized based on three parameters through separate experiments: (1) solvent volume, (2) extraction time, and (3) extraction temperature. The extraction procedure was repeated three times. Subsequently, the extract was purified using a Supelclean ENVI-Carb SPE cartridge. The eluate was evaporated under a nitrogen stream and analyzed by UPLC-MS/MS to determine the recovery efficiency (H%)8. which was calculated using Equation (*).
where H% stands for recovery efficiency (%), C_spike represents the standard spike concentration (ng/mL), and C_analysisis the analyte concentration in the spiked blank sample.
(1) Optimization of the solvent volume: MeOH is toxic19; thus, its use should be carefully managed during the extraction of PFAS from TSP samples. Here, four MeOH volumes were tested to determine the optimal solvent volume: 3 mL (A1), 4 mL (A2), 5 mL (A3), and 6 mL (A4). Each condition was evaluated based on recovery efficiency.(2) Optimization of the extraction time: The duration of ultrasonication influences the extraction efficiency, typically reaching a maximum at equilibrium20. Beyond this point, prolonged extraction may offer diminishing returns and could lead to the degradation of sensitive analytes. Three durations were tested to identify the optimal extraction time: 10 minutes (B1), 20 minutes (B2), and 30 minutes (B3), using the previously optimized MeOH volume and MS/MS parameters.(3) Optimization of the extraction temperature: Temperature plays a critical role in reducing solvent viscosity, enhancing analyte solubility, and improving extraction efficiency. However, excessive heat may cause analyte degradation21. Here, three temperatures were evaluated: 30 °C (C1), 40 °C (C2), and 50 °C (C3), using the optimized MeOH volume and extraction time determined in the previous steps.
LODs and LOQs
The limits of detection (LODs) and limits of quantitation (LOQs) were determined using the optimized ultrasonic extraction procedure on a blank quartz filter spiked with a low concentration (0.2 ng/mL) of PFAS standards. The extract was purified using a Supelclean ENVI-Carb SPE cartridge, evaporated under a nitrogen stream, reconstituted in 990 µL of MeOH:H₂O (4:1, v/v), and spiked with 10 µL of internal standards (ISs). The final solution was filtered and analyzed by UPLC-MS/MS. The experiment was performed in seven replicates to ensure statistical reliability.
Instrument analysis
All measurements were performed using UPLC-MS/MS (ExionLC AC series, Triple Quad 3500, Sciex, USA). Separations were performed on a Kinetex C18 column (100 mm × 2.1 mm, 1.7 μm). The mobile phase gradient started with 10:90 of 20 mmol/L CHCOONH aqueous solution: acetonitrile (v/v) for 0.5 min, then increased to 95% in 10 min, held for 3 min, and finally returned to the initial composition. The injection volume, column temperature, and flow rate were 10 μL, 45 °C, and 0.2 mL/min, respectively3.
Sample collection
The developed method was used to analyze 24 PFAS in TSP samples collected in Ho Chi Minh City, Vietnam. The sampling site was located on the rooftop of the 6th floor of the G Block at the University of Science’s Linh Trung Campus. The surrounding area is influenced by various anthropogenic sources, including cooking, burning, traffic emissions, and nearby industrial activities. TSP samples were collected on pre-treated quartz filters (Advantec, Japan), using a high-volume air sampler (Kimoto Electric Co., Model 120H, Japan) operating at a flow rate of 600 L/min over a 24-hour sampling period. Before use, quartz filters were heated at 400 °C for 8 hours to remove impurities, cooled, and stabilized in a desiccator at 25 °C with a relative humidity of 30%–40%. After sampling, the filters were wrapped with aluminum foil to avoid photochemical reactions and determine the mass after stabilizing, and stored at ˗20 °C22. In total, four samples were collected from October 10 to 13, 2022, and three samples were collected from March 15 to 17, 2023.
Results and discussion
Mass spectrometry parameters
PFAS are acidic compounds that readily lose a proton (H⁺) because of their strong acidic functional groups, such as -COOH and -SO₃H. The loss of a proton forms the stable [M-H]⁻ ion, which is easily detected in the negative ESI mode. The stability of PFAS is due to electron-withdrawing fluorine atoms, which delocalize the negative charge, making the ionization process efficient. Thus, PFAS are well-suited for detection by ESI, commonly used in UPLC-MS/MS analysis (Voogt and Saez, 2006). Four basic parameters (DP, EP, CE, and CXP) directly affect the PFAS signals. DP and EP depend on the precursor ions, whereas CE and CXP depend on the product ions. The EP and CXP values had little impact on the signals and were set at ˗10 V3.
Analytical parameters of the 24 per- and polyfluoroalkyl substances (PFAS) detected in ultra-performance liquid chromatography-tandem mass spectrometry (UPLC-MS/MS) analysis.
|
No. |
Group |
Name |
Chemical formula |
Ret.Time (min) |
Parent ion (Da) |
Product ion (Da) |
MRM transitions |
DP (V) |
CE (V) | |
|
1 |
PFSAs: perfluoroalkane sulfonic acids |
Short-chain |
PFBS |
C4HF9O3S |
5.07 |
298.8 |
79.8 |
[C4F9SO3]- → [SO3]- |
-100 |
-60 |
|
2 |
PFPeS |
C5HF11O3S |
5.48 |
349 |
80 99 |
[C5F11SO3]- → [SO3]- |
-100 |
-70 | ||
|
3 |
Long-chain |
PFHxS |
C6HF13O3S |
5.85 |
398.8 |
80 |
[C6F13SO3]- → [SO3]- |
-110 |
-78 | |
|
4 |
PFHpS |
C7HF15O3S |
5.83 |
448.8 |
79.9 |
[C7F15SO3]- → [SO3]- |
-140 |
-98 | ||
|
5 |
PFOS |
C8HF17O3S |
6.62 |
498.8 |
79.9 |
[C8F17SO3]- → [SO3]- |
-140 |
-98 | ||
|
6 |
PFNS |
C9HF19O3S |
6.48 |
548.9 |
79.9 98.9 |
[C9F19SO3]- → [SO3]- |
-140 |
-100 -95 | ||
|
7 |
PFDS |
C10HF21O3S |
7.31 |
598.9 |
80.2 98.8 |
[C10F21SO3]- → [SO3]- |
-85 |
-110 -110 | ||
|
8 |
PFCAs: perfluoroalkyl carboxylic acids |
Short-chain |
PFBA |
C4HF7O2 |
4.18 |
212.7 |
168.9 103 |
[C4F7O2]-→ [C3F7]- |
-40 |
-12 -20 |
|
9 |
PFPeA |
C5HF9O2 |
4.64 |
263.9 |
69 191.8 |
[C5F9O2]- → [C4F9]- |
-40 |
-60 -35 | ||
|
10 |
PFHxA |
C6HF11O2 |
5.02 |
312.7 |
269.1 |
[C6F11O2]- → [C5F11]- |
-40 |
-15 | ||
|
11 |
PFHpA |
C7HF13O2 |
5.39 |
362.8 |
318.9 |
[C7F13O2]- → [C6F13]- |
-40 |
-14 | ||
|
12 |
Long-chain |
PFOA |
C8HF15O2 |
5.75 |
412.9 |
368.9 |
[C8F15O2]-→ [C7F15]- |
-50 |
-16 | |
|
13 |
PFNA |
C9HF17O2 |
6.11 |
462.6 |
419 219 |
[C9F17O2]-→ [C8F17]- |
-50 |
-16 -23 | ||
|
14 |
PFDA |
C10HF19O2 |
6.47 |
512.8 |
468.9 |
[C10F19O2]- → [C9F19]- |
-40 |
-14 | ||
|
15 |
PFUnA |
C11HF21O2 |
6.86 |
562.8 |
518.9 |
[C11F21O2]- → [C10F21]- |
-60 |
-18 | ||
|
16 |
PFDoA |
C12HF23O2 |
7.17 |
612.9 |
568.8 |
[C12F23O2]- → [C11F23]- |
-65 |
-18 | ||
|
17 |
PFTrDA |
C13HF25O2 |
7.54 |
662.9 |
618.8 |
[C13F25O2]- → [C12F25]- |
-60 |
-20 | ||
|
18 |
PFTeA |
C14HF27O2 |
7.85 |
713 |
219.1 669 |
[C14F27O2]-→ [C13F1]- |
-70 |
-35 -17 | ||
|
19 |
PFAA precursors |
FOSA: Perfluoroalkyl sulfonamides |
NEtFOSAA |
C12H8F17NO4S |
6.81 |
583.9 |
526 419 |
[C12H7F17NO4S]- →[C12H6F16NO4S]- |
-100 |
-30 -29 |
|
20 |
NMeFOSAA |
C11H6F17NO4S |
6.63 |
569.8 |
168.8218.9419483 |
[C11H5F17NO4S]-→[C11H4F16NO4S]- |
-110 |
-37 -35 -27 | ||
|
21 |
PFOSA |
C8H2F17NO2S |
8.11 |
497.6 |
77.8 477.9 |
[C8H2F17NO2S]-→[C12H6F16NO4S]- |
-100 |
-76 -32 | ||
|
22 |
FTS: Perfluorohexanesulfonic acid |
4:2 FTS |
C6H5F9O3S |
4.51 |
326.9 |
81 307 |
[C6H4F9SO3]- →[C6H3F8SO3]- |
-90 |
-55 -27 | |
|
23 |
6:2 FTS |
C8H5F13O3S |
5.56 |
426.9 |
406.8 |
[C8H4F13SO3]- →[C8H3F12SO3]- |
-100 |
-35 | ||
|
24 |
8:2 FTS |
C10H5F17O3S |
5.84 |
527 |
80.7 507 |
[C10H4F17SO3]- →[C10H3F16SO3]- |
-130 |
-90 -40 | ||
The retention times of the 24 PFAS showed a positive correlation with increasing carbon chain length. In the PFSA group, compounds with longer carbon chains (e.g., PFDS and PFOS) exhibited longer retention times than those with shorter chains (e.g., PFBS and PFPeS). Similar results were observed in the PFCA group. Furthermore, variations in chemical structure may also influence retention times. PFSAs generally have longer retention times than PFCAs of the same carbon chain length.
Optimization of the ultrasonic extraction process
(1) Optimizing solvent volume
MeOH was chosen as the extraction solvent because of its high efficiency in dissolving PFAS, stemming from its ability to interact with the non-polar C-F chains and enhance desorption from particulate surfaces. MeOH also exhibits superior wetting properties compared to other organic solvents, facilitating deeper penetration into the particulate matrix and increasing the extraction yield. Hence, MeOH is widely used as the standard solvent in PFAS extraction from atmospheric PM, offering an optimal balance of polarity, low viscosity, and compatibility with SPE clean-up and UPLC-MS/MS analysis1, 6, 11, 12.
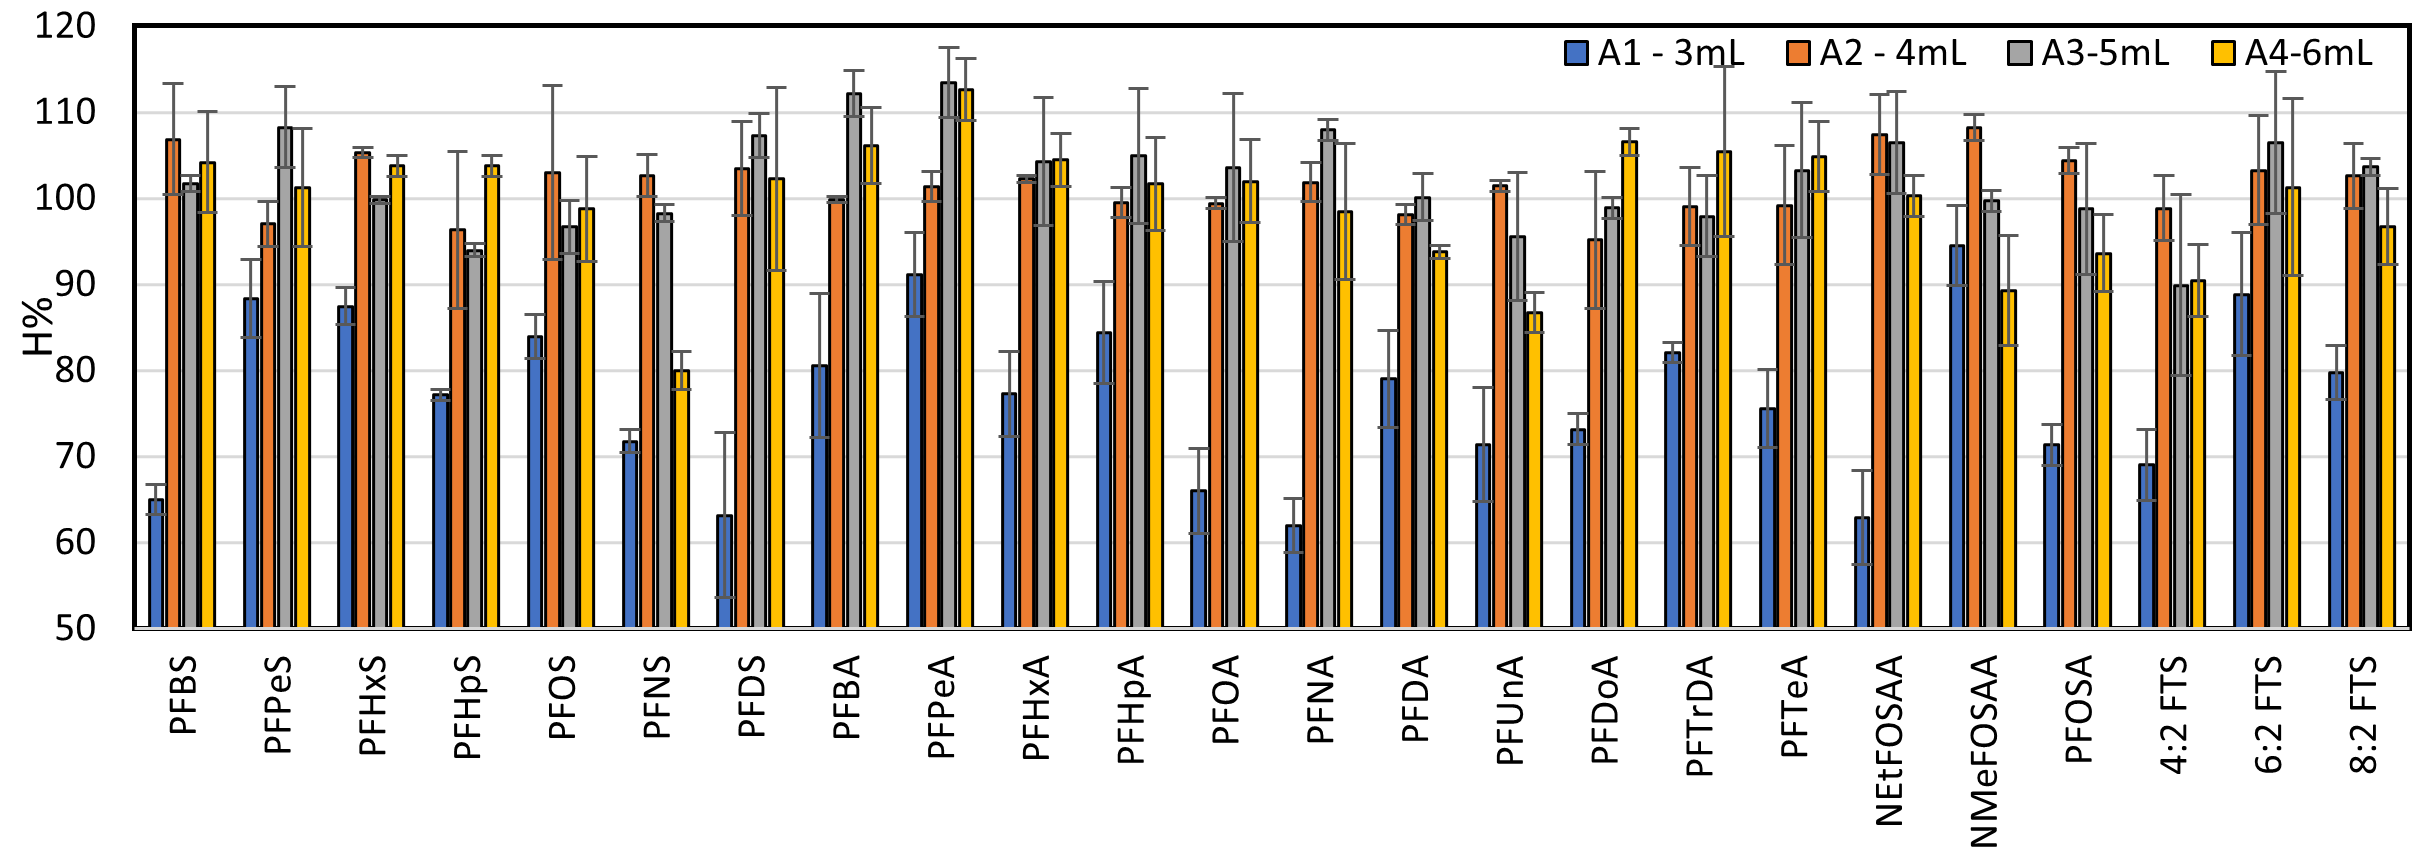
Recovery efficiencies of 24 PFASs at different extraction volumes. Standard deviation bars correspond tovariations within three replicates.
The recovery efficiencies obtained from testing extraction volumes of 4, 5, and 6 mL met the Association of Official Analytical Collaboration (AOAC) International criteria for acceptable recovery (typically 70% – 120%), indicating that each tested volume provided reliable extraction performance. Among them, a 4 mL volume was selected as the optimal choice, as it balanced high recovery with reduced solvent consumption and shorter processing time through the SPE column. This MeOH volume has been mentioned in previous studies, as it ensures effective analyte extraction from the sample matrix while improving the overall efficiency of the analytical workflow6.
(2) Optimizing extraction time
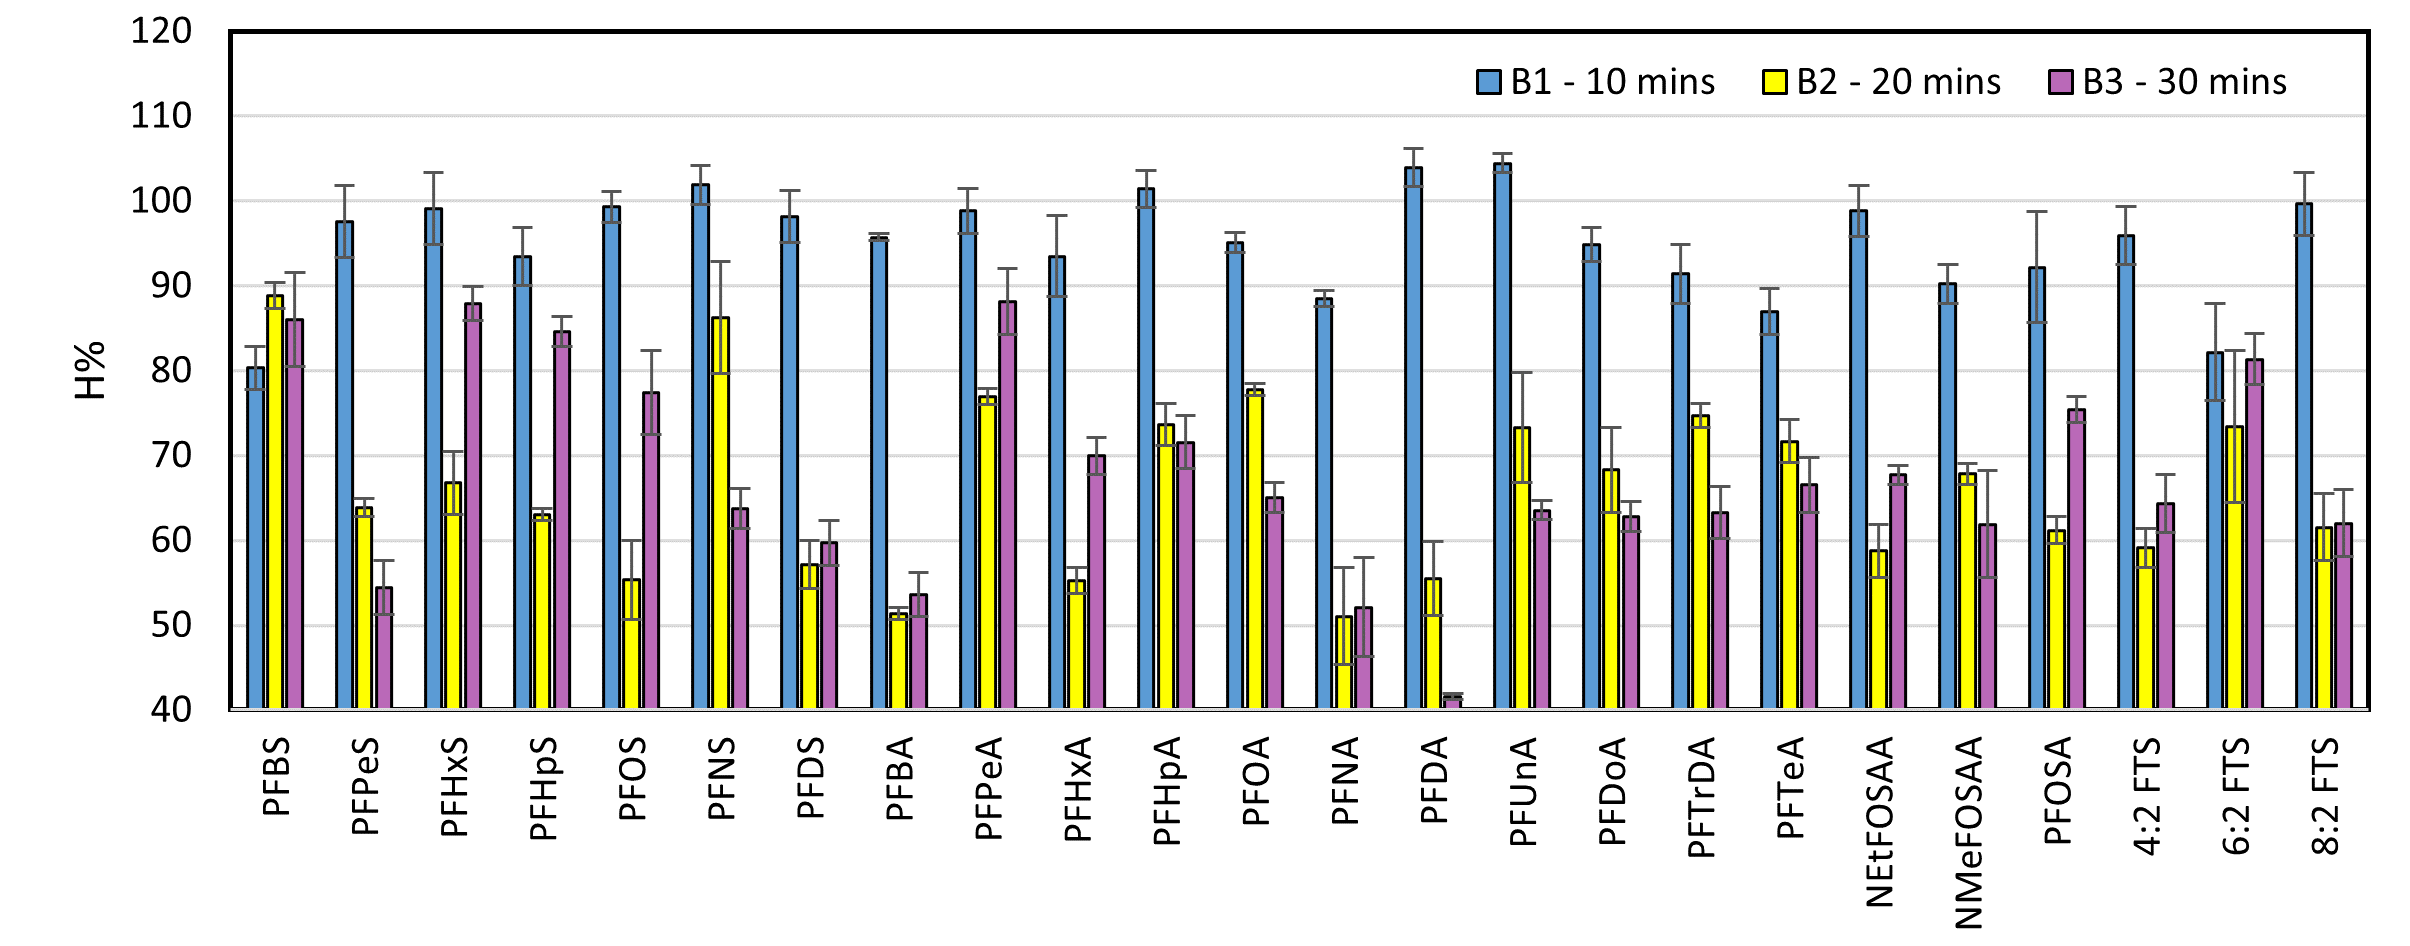
Recovery efficiencies of PFASs at different extraction times. Standard deviation bars correspond to variations within three replicates.
The results indicate that ultrasonic extraction achieves high efficiency within the first 10 minutes, suggesting that a 10-minute duration per extraction is sufficient to maximize analyte recovery from the sample matrix. Furthermore, performing three successive extractions ensures complete transfer of analytes into the solvent. A 10-minute extraction time also agrees with protocols adopted in previous studies, supporting its reliability and effectiveness6.
(3) Optimizing extraction temperature
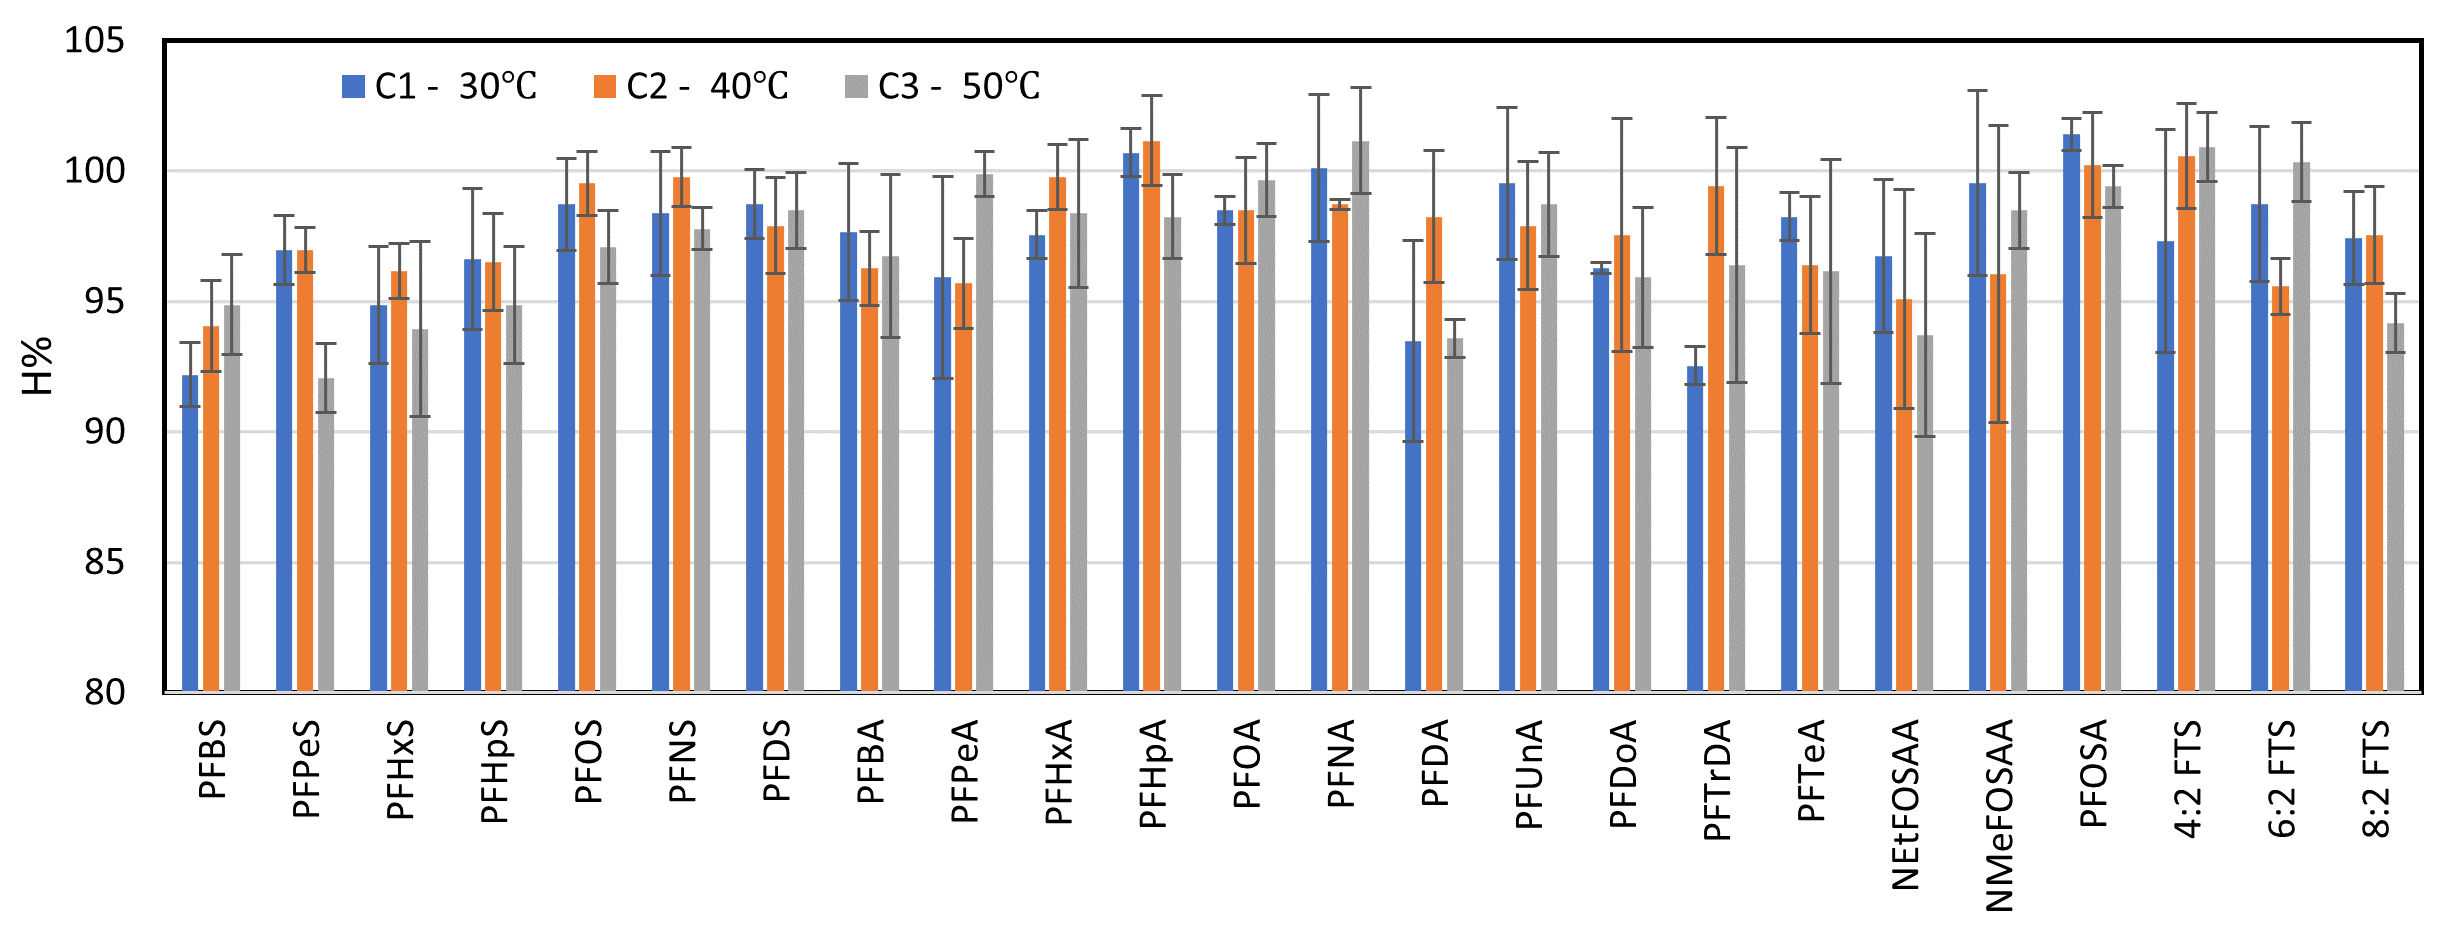
Recovery efficiencies of PFASs at different extraction temperatures. Standard deviation bars correspond to variations within three replicates.
The recovery efficiency and %RSD values obtained at different extraction temperatures met the AOAC standards for all analytes. Among the tested conditions, ultrasonic extraction at 40 °C and 50 °C yielded the highest extraction efficiencies. Theoretically, increasing the extraction temperature enhances analyte solubility and transfer into the solvent phase. However, to prevent excessive heating and reduce energy consumption and processing time in the ultrasonic bath, 40 °C was selected as the optimal extraction temperature. This temperature has been used in previous studies, supporting its applicability and effectiveness6.
LOQs and application to PFAS determination in TSP samples
This study presents the first method for analyzing PFAS in TSP in Vietnam.
LOQs and concentrations of 24 PFASs in 7 TSP samples collected from ambient air in Ho Chi Minh City
|
PFAS |
LOQ (ng/mL) |
Samples (pg/m3) |
%RSD |
H% | ||||||
|
Sample 1 |
Sample 2 |
Sample 3 |
Sample 4 |
Sample 5 |
Sample 6 |
Sample 7 | ||||
|
PFBA |
0.07 |
92.8 |
187.6 |
157.8 |
137.6 |
261.6 |
162.1 |
207.4 |
0.2 |
100.0 |
|
PFPeA |
0.02 |
19.7 |
89.0 |
101.1 |
37.8 |
18.2 |
24.7 |
23.0 |
0.5 |
108.5 |
|
PFHxA |
0.04 |
14.3 |
91.5 |
124.0 |
31.0 |
25.4 |
88.6 |
19.8 |
0.0 |
95.5 |
|
PFHpA |
0.03 |
120.6 |
1894.5 |
1763.1 |
447.0 |
37.8 |
11.8 |
101.7 |
0.7 |
100.0 |
|
PFOA |
0.04 |
2.9 |
50.9 |
75.2 |
10.8 |
10.3 |
5.9 |
9.0 |
1.7 |
110.5 |
|
PFBS |
0.03 |
1.1 |
1.4 |
<LOD |
<LOD |
7.1 |
2.4 |
1.8 |
0.3 |
112.9 |
|
PFHxS |
0.03 |
1.3 |
1.0 |
1.0 |
1.6 |
5.7 |
1.7 |
1.6 |
0.2 |
105.5 |
|
PFHpS |
0.02 |
2.1 |
0.7 |
1.4 |
0.6 |
3.7 |
2.2 |
1.7 |
1.9 |
111.5 |
|
PFOS |
0.04 |
1.2 |
3.6 |
4.0 |
2.7 |
3.3 |
3.0 |
2.0 |
4.6 |
103.9 |
|
PFDA |
0.04 |
<LOD |
4.0 |
8.8 |
2.1 |
1.0 |
3.3 |
1.7 |
0.4 |
108.5 |
|
PFUnA |
0.02 |
2.7 |
1.1 |
2.4 |
0.6 |
1.0 |
0.8 |
1.6 |
0.8 |
102.6 |
|
PFDoA |
0.01 |
0.4 |
1.9 |
1.8 |
1.2 |
1.4 |
1.2 |
0.7 |
0.9 |
101.4 |
|
PFTrDA |
0.10 |
<LOD |
<LOD |
<LOD |
<LOD |
<LOD |
<LOD |
<LOD |
0.2 |
112.4 |
|
6-2FTS |
0.07 |
2.3 |
3.6 |
22.7 |
5.6 |
3.9 |
4.1 |
2.9 |
0.9 |
98.0 |
|
PFPeS |
0.07 |
1.2 |
3.1 |
2.4 |
1.1 |
ND |
17.7 |
9.2 |
0.1 |
98.3 |
|
PFNS |
0.15 |
<LOD |
<LOD |
<LOD |
<LOD |
2.8 |
2.8 |
2.7 |
0.4 |
100.8 |
|
PFDS |
0.14 |
2.9 |
<LOD |
<LOD |
<LOD |
3.6 |
2.6 |
3.0 |
0.4 |
112.2 |
|
4-2FTS |
0.04 |
0.8 |
<LOD |
<LOD |
0.8 |
3.6 |
2.3 |
ND |
4.8 |
100.2 |
|
8-2FTS |
0.11 |
<LOD |
<LOD |
<LOD |
<LOD |
ND |
ND |
ND |
2.8 |
104.8 |
|
PFNA |
0.16 |
3.8 |
<LOD |
4.9 |
<LOD |
4.8 |
5.1 |
ND |
3.1 |
114.8 |
|
PFTeA |
0.01 |
0.4 |
0.6 |
0.3 |
0.6 |
1.5 |
0.9 |
0.9 |
4.4 |
113.3 |
|
NEtFOSAA |
0.01 |
2.8 |
2.6 |
2.2 |
2.1 |
2.8 |
2.7 |
ND |
3.3 |
101.5 |
|
NMeFOSAA |
0.04 |
<LOD |
ND |
<LOD |
<LOD |
4.4 |
ND |
ND |
12.6 |
103.5 |
|
PFOSA |
0.08 |
<LOD |
<LOD |
<LOD |
<LOD |
3.1 |
2.7 |
2.2 |
5.3 |
96.0 |
|
Total PFAS |
273.3 |
2337.0 |
2273.2 |
683.1 |
407.1 |
348.7 |
392.9 | |||
|
Standard Deviation (SD) |
34.0 |
469.2 |
435.3 |
113.2 |
56.3 |
38.5 |
52.0 | |||
“<LOD” indicates concentrations below the limit of detection; “ND” means not detected.
Based on the analysis, 22 of 24 PFAS were detected in the samples, except for PFTrDA and 8:2FTS. Furthermore, 12 of 24 PFAS were found across all samples: PFBA, PFPeA, PFHxA, PFHpA, PFOA, PFHxS, PFHpS, PFOS, PFUnA, PFDoA, 6-2FTS, PFTeA. Among these, PFHpA exhibited the highest concentration, followed by PFBA. This result is in line with the findings of previous studies on PFAS in airborne dust in Japan (6,27). The concentration trend observed was PFHpA > PFBA > PFHxA > PFPeA > PFOA, with PFNS showing a markedly lower concentration. This distribution highlights the varying prevalence of different PFAS in the TSP samples.
Conclusions
We developed and validated a sensitive, accurate, and efficient analytical method for the quantification of 24 per- and polyfluoroalkyl substances (PFAS) in total suspended particulate matter (TSP) samples, using Supelclean ENVI-Carb solid-phase extraction and UPLC-MS/MS. The method exhibited excellent analytical performance, including low limits of quantification, high recovery rates, and strong repeatability, confirming its reliability for PFAS determination in particulate matter. Application of the method to ambient TSP samples collected in Ho Chi Minh City detected 22 of 24 target PFAS, underscoring the widespread presence of these persistent organic pollutants in the urban atmosphere. These findings emphasize the need for increased attention to PFAS as emerging air pollutants in rapidly developing urban environments. These results can serve as a scientific basis for environmental authorities to consider developing regulatory guidelines or monitoring programs for airborne PFAS. Future research should focus on expanding the spatial and temporal scope of sampling and investigating the potential health risks associated with inhalation exposure to PFAS, particularly in densely populated areas.
Competing Interests
The author(s) declare that they have no competing interests