

Evaluating the applicability of a low-cost sensor for measuring PM2.5 concentration in Ho Chi Minh city, Viet Nam
- Faculty of Environment, VNUHCM-University of Science
- University of Science, VNU-HCM
Abstract
Introduction: Continuous monitoring provides real-time data which is helpful for measuring air quality; however, these systems are often very expensive, especially for developing countries such as Vietnam. The use of low-cost sensors for monitoring air pollution is a new approach in Vietnam and this study assesses the utility of low-cost, light-scattering-based, particulate sensors for measuring PM2.5 concentrations in Ho Chi Minh City.
Methods: The low-cost sensors were compared with both a Beta attenuation monitor (BAM) reference method and a gravimetric method during the rainy season period of October to December 2018.
Results: The results showed that there was a very strong correlation between two low-cost sensors (R = 0.97, slope = 1.0), and that the sensor precision varied from 0 to 21.4% with a mean of 3.1%. Both one-minute averaged data and one-hour averaged data showed similar correlations between sensors and BAM (R2 = 0.62 and 0.69, respectively), while 24-hour averaged data showed excellent agreement (R2 = 0.95, slope = 1.05). In addition, we also found a strong correlation between those instruments and a gravimetric method using 24-hour averaged data. A linear regression was used to calibrate the 24-hour averaged sensor data and, once calibrated, the bias dropped to zero.
Conclusion: These results show that low-cost sensors can be used for daily measurements of PM2.5 concentrations in Ho Chi Minh City. The effect of air conditions, such as temperature and humidity, should be conducted. Moreover, technical methods to improve time resolution of lowcost sensors need to be developed and applied in order to provide real-time measurements at an inexpensive cost.
Introduction
Particulate matter is one of the most important components of air pollution. The particulate matter is emitted from various sources which may affect the size and composition of the particles. Particulate matter whose aerodynamic diameter is 2.5 µm or below is known as PM. The smaller the particles are, the easier it is for them to penetrate the respiratory system and for PM to enter into human blood 1. In addition, the composition of particles is also an important factor that directly affects human health. PM affects not only human heath but also has an impact on the global climate. There are a variety of methods used for determining the concentration of particles in the atmosphere. Both gravimetric and continuous methods 2,3 such as impactors (gravimetric method), tapered element oscillating microbalances and beta attenuation monitors are widely used, while instruments such as the DustTrak and SidePak use light scattering to obtain particle mass concentrations. These methods are often time-consuming or expensive, especially for continuous monitoring devices.
Around the world the application of low-cost sensors in monitoring air pollutants has received a great deal of attention in recent years with one of the first studies of small, low-cost sensors being recently described 4. Based on the report from the World Meteorological Organization, imple, low-cost single pollutant sensors are available for below $50 USD. High-cost sensor have not been clearly defined however, more sophisticated multi-parameter, fully autonomous sensors systems with hardware cost more than ~ $10,000 USD 5. Low-cost dust sensors based on light scattering have been developed 6, and usually consist of an infrared emitting diode and a phototransistor. Air particles pass through the sensor, scatter light, and the detector measures the intensity of the scattered light which is related to the mass concentrations of particles 7. There has been an increasing focus on calibrating the performance of low-cost sensors to account for the effects of particle size, composition, atmospheric temperature and humidity, etc, against established reference methods 7,8. Low-cost sensors have some important limitations, such as stability and cross-sensitivity. There is much to be gained by comparing the performance of low-cost sensors against reference devices and methods under a range of environmental conditions.
There is no national monitoring network for PM concentrations in Vietnam and measurement data are still rare. The few previous studies of the levels of PM in Vietnam found very high concentration that greatly exceed the Vietnam National Technical Regulation on Ambient Air Quality or World Health Organization ambient air quality standards 9,10.
Ho Chi Minh City is a populous city and one of the economic hubs of Vietnam. Besides economic activities, environmental protection has increasingly become an important issue. As such there is a clear need for monitoring in Ho Chi Minh City. Unfortunately, since 2010 automatic monitoring stations belonging to the Ho Chi Minh City Air Quality Monitoring Network have not been able to operate. Therefore, data of air quality, especially particulate matter (PM), are lacking.
The application of low-cost sensors to measure air quality is a new approach in Vietnam. There has been one previous study in Hanoi using a Panasonic PM sensor 9, while there have not been any papers on the application of low-cost sensors in air quality assessment in Ho Chi Minh City. Therefore, in this study, we compare a Plantower Laser PM dust sensor PMS 3003 against reference methods, with the aim of assessing the applicability of low-cost sensors for measuring PM.
METHODS AND MATERIALS
Setting up PM sensor
The Plantower Laser PM dust sensor PMS 3003 is a low-cost (~ $15 USD) commercially-available laser particle sensor. This sensor is used for measuring PM in a network of low-cost devices from Location Aware Sensing Systems. The sensor effective measurement range is between 0 and 500 µg/m, with a resolution of 1 µg/m. The working conditions (temperature and relative humidity) of the sensors are -10 to 60 °C and 0 to 99%, characteristics which are suitable for measuring the PM in ambient air in Ho Chi Minh City. A Plantower Laser PM dust sensor and a LinkIt ONE board were combined to become a low-cost sensor (<100$), as illustrated in Figure 1a. The data from two of these low-cost sensors were compared against those obtained with a reference method, using a FH 62 C14 beta attenuation monitor (BAM) (Thermo Scientific, USA). The BAM was situated in the air monitoring station of the Faculty of Environment, VNU-HCM University of Science, located on the rooftop of a 11-storey building. The BAM is calibrated twice per year by mass foils. The two sensors and the BAM were located physically close to each other so that the two devices could measure the same air (Figure 1b).
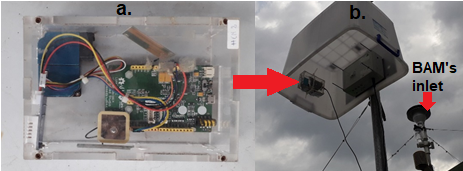
A combination of a Plantower Laser PM2.5 dust sensor PMS3003 and a LinkIt ONE board as a sensor system (a); location of sensor and BAM (b).
Collecting data
The instruments were run for three months from October 2018 to December 2018, and one-minute sensor readings were averaged over one-hour and 24-hour periods, for comparison with BAM and gravimetric data (obtained with an SKC Inc Impactor at 10 L/min over 24 hours on quartz fiber filters). Initially the two low-cost sensors were tested over two days to compare their responses to atmospheric PM concentrations. Subsequently, data from the sensors and BAM were collected at the same time and same location, with a 1-week period of coincident impactor measurements.
Calibrating the low-cost sensor
The laboratory calibration method was provided by the EPA 2014 Air Sensor Guidebook 11. We compared the response of the low-cost sensor with data from the reference device. Then, we created a calibration curve that relates the responses of the low-cost sensor to the reference instrument using a mathematical equation. We used a set of one month of sensor data for plotting a calibration curve and then applied the mathematical equation to the data from the following month. Finally, bias was calculated to assess the performance of low-cost sensor.
RESULTS
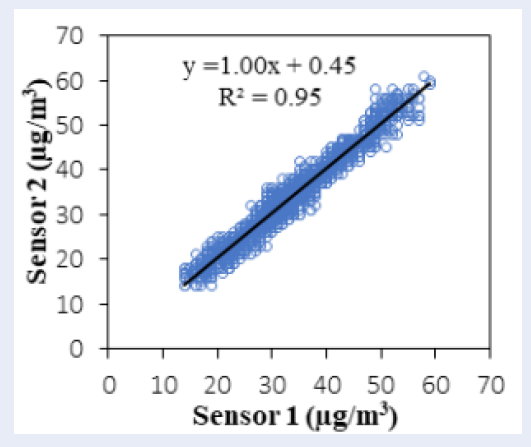
To obtain theintra-sensor correlation,a scatter plot of one-minute data from two days of sensor measurements was created, as illustrated in Figure 2. It shows a very good correlation between the two low-cost sensors (R = 0.95, slope = 1).

Scatter plot between the two sensors (n=2634).
The sensor data were compared to those of the BAM using one-minute data, one-hour averages, and 24-hour averages. The one-minute sensor and BAM data show a correlation of R=0.62 and a slope = 0.75, with the correlation of one-hour averages being slightly better (R = 0.69). However, a strong correlation between the 24-hour averages of the two instruments was found (R = 0.96, slope = 0.88). Figure 3 illustrates the variation of one-minute data and 24-hour averaged data of the low-cost sensor and BAM over the measurement period.

Variation of minute data (a) and 24-hour averaged data (b) of the low-cost sensor (red line) and BAM (blue line).
DISCUSSION
The response of two low-cost sensors to PM
As shown in Figure 2, there was a very good correlation between the two low-cost sensors (R = 0.95, slope = 1) which is in agreement with the study by Sayahi, which also found high agreement between the same type of low-cost sensors 12. A statistical t-test was used to determine if there are any significant differences between the two measurements, and the results are shown in
The t-test result of the two sensors
| t-Test: Two-Sample Assuming Unequal Variances | ||
|---|---|---|
| Sensor 1 | Sensor 2 | |
| Mean | 33.86 | 34.16 |
| Variance | 69.46 | 72.40 |
| Observations | 2634 | 2634 |
| Hypothesized Mean Difference | 0 | |
| t Stat | -1.28 | |
| P(T<=t) two-tail | 0.20 | |
| t Critical two-tail | 1.96 | |
Comparison of sensor to BAM
The one-minute data from the sensors showed very similar variations of PM to those measured by the BAM. However, there were many spikes in the sensor data (Figure 3 a) which were not evident in the BAM record. Although the 24-hour averaged data of the sensors give very similar results to the BAM, the spikes in the 24-hour averaged data were higher than those of the BAM. The study of similar sensors in Hanoi showed a higher correlation of hourly data between a Panasonic sensor and a BAM (3.1 km away from Panasonic sensor), with R = 0.85 and slope of 0.99 9. The Panasonic and Plantower sensors are both low-cost sensors which are based on the light scattering principle. However, there are no studies comparing these sensors against each other.
To compare sensor data to the true value of PM obtained from BAM, bias calculations can be performed. Bias is a fixed value that is added or subtracted from the true value due to the response of the sensor 11. A bias calculation is as follows: , where B is the bias, C is the average of the sensor, and Cis the true concentration of the pollutant. Zero bias is ideal, but bias values lower than 0.1 can be acceptable. The bias calculated for one-minute, one-hour and 24-hour averaged data were 0.66, 0.43 and 0.11, respectively. The bias of the one-minute data was large; however, the bias of the 24-hour averaged data was acceptable.
Over a seven-day period, both the sensor and BAM data were compared against a gravimetric method and both showed high correlations with the impactor data (R = 0.95 for sensor and R = 0.99 for BAM, (n = 7)). The 24-hour averages of the sensor, BAM and filters were 34.6 ± 10.5, 31.9 ± 9.9, and 30.9 ± 10.6 µg/m, respectively.
Calibration of low-cost sensor
Calibrations of the sensor measurements were performed using 24-hour averaged data from the low-cost sensor because these data gave the highest correlation with the BAM. A calibration curve that relates sensor to BAM data was created by linear regression resulting in the equation Y = 0.74X + 4.41, where Y is the calibrated value and X is the measured sensor value. Calibrated 24-hour averages of PM are shown in Figure 4.

After the calibration, the sensor data were much closer to the true value of PM, with the bias decreasing from 0.11 to 0.01. To test the calibration, the linear equation was applied to 10 more days of sensor data. The mean of the 24-hour averaged data of the sensor, BAM, and sensor were 27.0 ± 6.0, 24.8 ± 4.9, and 24.3 ± 4.5, respectively. The bias also decreased from 0.08 to -0.01. These results suggest that a linear relationship can be used for calibrating 24-hour averaged data obtained from the Plantower Laser PM dust sensor. For comparison with other studies, as
Performance of different low-cost particles sensors
| Sensor | Sampling time | Reference method | Coefficient (R2) | Mathematical equation | Bias % | References |
|---|---|---|---|---|---|---|
| DC1700 | minutely | CPC and SMPS | 0.99 | - | -1.1 to -9.1 | 7 |
| Panasonic-PM2.5 sensor | hourly | BAM | 0.73 | Y = 1.4X | - | 9 |
| Plantower PMS 1003/5003 | hourly | TEOM | 0.18 - 0.32 (in spring) | Various models | -22.1 to -29.1 | 12 |
| 24-h averaged | 0.88 - 0.97 | - | ||||
| Plantower PMS3003 | 24-h averaged | BAM | 0.90 | Y = 0.74X + 4.41 | -0.01 | This study |
| CPC: Condensation particle counter SMPS: Scanning Mobility Particle Sizer TEOM: Tapered element oscillating microbalance | ||||||
The Plantower sensors give the highest correlation coefficient when comparing 24-hour measurements to the reference method. However, it is not good for measuring higher time resolutions, such as hourly and minute data. The Panasonic and DC1700 could effectively compare hourly and minute data; however, the DC1700 (~ $400 USD) has a much higher cost than the Panasonic or Plantower sensors (~ $15 USD). The DC1700 is a completed sensor system that can measure PM in air without any further buildup.
CONCLUSION
This study focused on evaluating the applicability of low-cost sensors for measuring PM concentration in Ho Chi Minh City. The results showed that the Plantower sensor had a high intra-sensor correlation (R = 0.97, slope = 1) and that during a three-month test under real conditions, it was found that 24-hour measurements of the sensor can be used for PM monitoring in Ho Chi Minh City. After calibration, the bias was approximately zero and close to the true value of PM concentrations in the air. In the future, research on the effects of temperature and humidity in each season in Ho Chi Minh City on the performance of low-cost sensors should be conducted. Moreover, the technical methods to improve time resolution of low-cost sensors need to be developed and applied so that they can provide real-time measurements at a relatively inexpensive cost.
LIST OF ABBREVIATIONS
BAM: beta attenuation monitor
PM: Particulate matter
CV: Coefficient of variation
CPC: Condensation particle counter
SMPS: Scanning Mobility Particle Sizer
TEOM: Tapered element oscillating microbalance
Authors' Contributions
The author Nguyen Doan Thien Chi did the experiment and wrote the manuscript. The author To Thi Hien discussed the results and contributed to the final manuscript. All authors approved the final manuscript.
COMPETING INTERESTS
The authors declare that they have no competing interests.