

Forecasting of saline intrusion in Ham Luong river, Ben Tre province (Southern Vietnam) using Box-Jenkins ARIMA models
- Institute of Tropical Biology, Vietnam Academy of Science and Technology, 85 Tran Quoc Toan Str., District 3, Ho Chi Minh City, Vietnam
- 1. Institute of Tropical Biology, Vietnam Academy of Science and Technology, 85 Tran Quoc Toan Str., District 3, Ho Chi Minh City, Vietnam
- 2. Graduate University of Science and Technology, Vietnam Academy of Science and Technology, 18 Hoang Quoc Viet Str., Cau Giay District, Ha Noi City, Vietnam
- Department of Science and Technology of Ben Tre Province, 280 Str. 3/2, Ward 3, Ben Tre City, Ben Tre, Vietnam
Abstract
Introduction: Ham Luong River is a branch of Mekong River located in Ben Tre Province, which has played a crucial role in supporting livelihoods of local residents and the province's economic development. However, the saline intrusion has been expanding in Ham Luong River, which seriously affects the productive agriculture, aquaculture, and further causes tremendous difficulties for local people's lives. Thus, it is crucial to have research for forecast the saline intrusion in Ham Luong River. Our aim was to develop mathematical models in order to forecast the saline intrusion in Ham Luong River, Ben Tre Province.
Methods: The Auto regressive integrated moving average (ARIMA) model was built to forecast the weekly saline intrusion in Ham Luong River, which has been obtained from Ben Tre Province's Hydro-Meteorological Forecasting Center over eight years (from 2012 to 2019).
Results: The saline concentration increased from January to March and then decreased from April to June. The highest salinity occurred in February and March while the lowest salinity was observed in early June. Moreover, the ARIMA technique provided an adequate predictive model for a forecast of the saline intrusion in An Thuan, Son Doc, and An Hiep station. However, the ARIMA model in My Hoa and Vam Mon might be improved upon by other forecasting methods.
Conclusion: Our study suggested that the nonseasonal/seasonal ARIMA is an easy-to-use modeling tool for a quick forecast of the saline intrusion.
INTRODUCTION
Ham Luong River (HLR) (in Vietnamese: Sông Hàm Luông) is a branch of the Mekong River in the Mekong Delta region that flows entirely within Ben Tre Province (BTP). HLR has played a crucial role in supporting the livelihoods of local residents, giving a productive environment for agriculture, aquaculture, capture fisheries, non-fish aquatic goods, and tourism revenue1. However, saline intrusion (SI) has been expanding in Mekong Delta, especially in BTP in recent years, which seriously affect the productive agriculture, aquaculture, and also causes tremendous difficulties for local people’s lives2. In the dry season, the saline water from the East Sea has intruded into HLR, and after that continued intrusion into complicated canal networks in BTP. SI is a complex phenomenon depending on a variety of variables include freshwater discharge from upstream, capacity, and morphology of the rivers/canals, a configuration of the drainage network, tidal conditions, and presence of control artificial structures such as dams, sluice gates4, 3. Moreover, the impacts of climate change and sea-level rise also exacerbate the damage of SI5. However, SI might be predicted by using statistical models. Therefore, it is crucial to have research for forecast SI in HLR in order to give useful information that can be used in water resource management and saltwater monitoring as well.
Nowadays, capabilities to predict SI was a principle of interest in many studies. Various models have been developed to predict SI in main rivers. An artificial intelligence model, like an Artificial Neural Network (ANN) model6, simulate SI using a trained neural network. Remote sensing techniques, like resolution applications of available satellite images for detecting SI. However, these methods mostly rely on complex statistics, artificial intelligence techniques, and large amounts of meteorological and topographic data7. This leads to needing a model that is reliability, accurate, suitability whereas small amounts of hydrodynamic. The Auto regressive integrated moving average (ARIMA) model is regarded as a smooth method, and it is applicable when the data is reasonably long and the correlation between past observations is stable8. ARIMA model9, also known as the Box-Jenkins model or methodology, is commonly used in forecasting and analysis. Some significant advantages of ARIMA forecasting are: first, it only needs endogenous variables and does not need to use other exogenous variables. Second, the ARIMA technique only requires the prior data of a time series to generalize the forecast. Hence, it can increase the forecast accuracy while keeping the number of parameters to a minimum10. This lead to the ARIMA model has been applied to analyze hydrological time series, especially at the monthly scale11.
Several studies in the literature have used the ARMA model for saline intrusion prediction. Sun and Koch (2001) used ARIMA to analyze and forecast of salinity in Apalachicola Bay, Florida. The results show that ARMIA has been possible to statistically define the interaction of different parameters that affect the salinity change in Apalachicola Bay provided help one understand the hydrodynamic circulation of the water body through the approach of data analysis12. Felisa et al. (2015) applied the ARIMA model to forecast the groundwater salinization in Ravenna (Italy). The resulting predictive models were validated by comparison with data and demonstrated that data-driven approaches may provide useful information in situations where physics-based models have only limited success in characterizing the phenomenon of interest13. As well as this, the ARIMA model is a major technique in hydrology and has been used extensively, mainly for the prediction of natural phenomena such as precipitation, streamflow events, solar radiation15, 14, 11.
Here, our primary objective was to develop the ARIMA model to forecast the weekly SI of HLR, BTP in consideration of the accuracy, suitability, adequacy, and timeliness of a collected data, which have been obtained from Ben Tre Province’s Hydro-Meteorological Forecasting Center (BTHMFC) over eight years (from 2012 to 2019). The reliability, accuracy, suitability, and performance of the model are investigated in comparison with those of established tests, such as standardized residuals.
MATERIALS AND METHODS
Study area and dataset collection
HLR is separated from Tien River in Tan Phu Commune, Chau Thanh District, BTP, creating a natural border between Bao and Minh islet. It has 72 km long, from 12 to 15 m in-depth, and from 1,200 to 1,500 m (over 3,000 m at estuary) in width. During the rainy season, average river flows are approximately 3,300–3,400 m/s, while around 800–850 m/s in the dry season16.
There are six saltwater monitoring stations (from estuary to upstream) situated in An Thuan-AT (Tiem Tom harbor, Ba Tri District), Son Doc-SD (Hung Le Commune, Giong Trom District), Phu Khanh-PK (Phu Khanh Commune, Thanh Phu District), My Hoa-MH (Ben Tre city), An Hiep-AH (An Hiep Commune, Chau Thanh District), and Vam Mon-VM (Phu Son Commune, Cho Lach District) (Figure 1). In each station, the saltwater monitoring data were collected one time per week for a period of 23 weeks (from January to June that is the dry season in Mekong Delta). The river saltwater monitoring data from 2012 to 2019 were provided by BTHMFC (available at http://www.bentre.gov.vn/Lists/ThongTinCanBiet/TongQuat.aspx). The present study forecast the SI in HLR from Jan 1-Jan 8 (week 1) to Jun 4-Jun 11 (week 23) of 2020 based on saltwater monitoring data from 2012 to 2019 (Appendix 1).

Map of Ham Luong River and its saltwater monitoring stations.
ARIMA models description and application
ARIMA was first formed by Box and Jenkin in 19769. The general equation of successive differences at the dth difference of Xt is briefly expressed as follows:
, where d is the different order, and B is the backshift operator
The successive difference at one-time lag equals to:
In this situation, the general non-seasonal ARIMA (p, d, q) is as follows:
, where is an auto-regressive operator of order p, is a moving average operator of order q, and
A general nonseasonal/seasonal ARIMA (p, d, q)x(P, D, Q)s model with nonseasonal parameters p, d, q, seasonal parameters P, D, Q, and seasonality s that consists of several terms: A nonseasonal autoregressive term of order p, a onseasonal differencing of order d, a nonseasonal moving average term of order q, a seasonal autoregressive term of order P, a seasonal differencing of order D, a seasonal moving average term of order Q. ARIMA(0,1,1)x(0,1,1)s–seasonal and nonseasonal MA terms of order 1 which was a common nonseasonal/seasonal ARIMA model. For a more detailed description of the terminology, see Box and Jenkins (1976)9, Bowerman and O’Connell (1987)17, and Pankraz (1991)18.
ARIMA modeling was developed using Statgraphics Centurion ver. 18 software. Model performance was evaluated using the root mean squared error (RMSE), the mean absolute error (MAE), the mean absolute percentage error (MAPE), the mean error (ME), the mean percentage error (MPE)19.
Map visualizations
An Inverse Distance Weighting (IDW) method in ArcGIS 10.3 was used to interpolate forecast point data to create continuous surface maps20:
where was the property at location i; was the property at location jDij was the distance from i to jG was the number of sampled locations, and was the inverse-distance weighting power.
RESULTS
Long-term saline intrusion data in Ham Luong River from 2012 to 2019
The saline concentration data in HLR for eight years that is obtained from the BTHMFC and Figure 2 presented the basic trends of the collected data. Overall, the saltwater concentration in HLR increased from February to April. The maximum saltwater occurred at the end of March or the beginning of April in which was the driest months in the year. Subsequently, the saltwater concentration decreased slightly in late May and fell rapidly in early June because of the seasonal change with rainfall in May. In early June, it is the beginning of the rainy season with much rainfall than those in May; therefore, the saline concentration decreased rapidly in the whole river. Notably, the highest saltwater concentration in HLR was observed in 2016 because of a severe El Niño, BTP experienced serious SI. The maximum saltwater concentration was 31.50 ‰ (05/02/2016), 26.01‰ (03/12/2016), 14.50‰ (03/12/2016), 12.40 (03/05/2016), 9.90‰ (03/12/2016), and 6.7% (03/12/2016) observed in AT, SD, PK, MH, AH, and VM, respectively. Saltwater (approximately 10‰) expanded through HLR by up to 50-60 km, considered to be the most extensive SI in the last 90 years.

The trend of saline intrusion in Ham Luong River from 2012 to 2019.
The ARIMA model for the forecast of saline intrusion in Ham Luong River
In AT station, the highest saline concentration of 25.34 ‰ is observed in week 6, followed by 21.25‰ (week 10) and 21.16‰ (week 9). Furthermore, week 12 was expressed as the highest saltwater concentration (13.24‰), week 5 (8.95‰), week 12 (4.67‰), week 4 (1.68‰), week 11 (0.72‰). By contrast, the lowest saltwater concentration of 12.46 ‰ is observed in week 23. The saltwater concentration measured from 5.09 (week 22) to 13.24 (week 12), 4.31 (week 22)-9.40 (week 12), 1.61 (week 22) to 4.67 (week 12), 0.00 (week 22)-1.49 (week 12), and 0.00 (week 22)-0.72 (week 11) in SD, PL, MY, AH, and VM, respectively. Clearly, at the beginning of the rainy season (from May 28 to Jun 11) observed with the lowest saltwater concentration. In turn, saline intrusion began in mid-March, saltwater entered deep to inland (Appendix 2).
Monthly average saltwater concentration (‰) in Ham Luong River from January to June of 2020. For: Forecast, 95% (L/H): the 95% prediction interval (low/high)
| Month | AT | SD | PK | |||
| For | 95% (L/H) | For | 95% (L/H) | For | 95% (L/H) | |
| January | 19.54 | 10.90/28.18 | 10.96 | 1.38/20.54 | 8.38 | 1.99/14.77 |
| February | 20.98 | 10.14/31.83 | 12.29 | 0.07/26.24 | 8.61 | 0.14/17.47 |
| March | 20.50 | 8.03/32.97 | 12.99 | 0.00/29.85 | 8.96 | 0.00/19.52 |
| April | 17.71 | 3.64/31.78 | 10.79 | 0.00/30.41 | 7.67 | 0.00/19.87 |
| May | 13.51 | 0.00/29.02 | 6.45 | 0.00/28.49 | 5.49 | 0.00/19.12 |
| June | 12.46 | 0.00/28.72 | 5.17 | 0.00/28.45 | 5.50 | 0.00/19.88 |
| Month | MH | AH | VM | |||
| For | 95% (L/H) | For | 95% (L/H) | For | 95% (L/H) | |
| January | 3.92 | 0.00/8.10 | 0.85 | 0.00/3.84 | 0.29 | 0.00/2.28 |
| February | 3.97 | 0.00/10.30 | 1.05 | 0.00/5.61 | 0.54 | 0.00/3.53 |
| March | 4.53 | 0.00/12.26 | 1.40 | 0.00/6.97 | 0.60 | 0.00/4.24 |
| April | 3.62 | 0.00/12.66 | 0.67 | 0.00/7.20 | 0.17 | 0.00/4.43 |
| May | 1.94 | 0.00/12.14 | 0.09 | 0.00/7.45 | 0.08 | 0.00/4.88 |
| June | 2.40 | 0.00/13.18 | 0.00 | 0.00/7.78 | 0.08 | 0.00/5.15 |

Time sequence plot displays for saltwater concentration in Ham Luong River include the forecasts and the forecast limits.
Testing forecast models
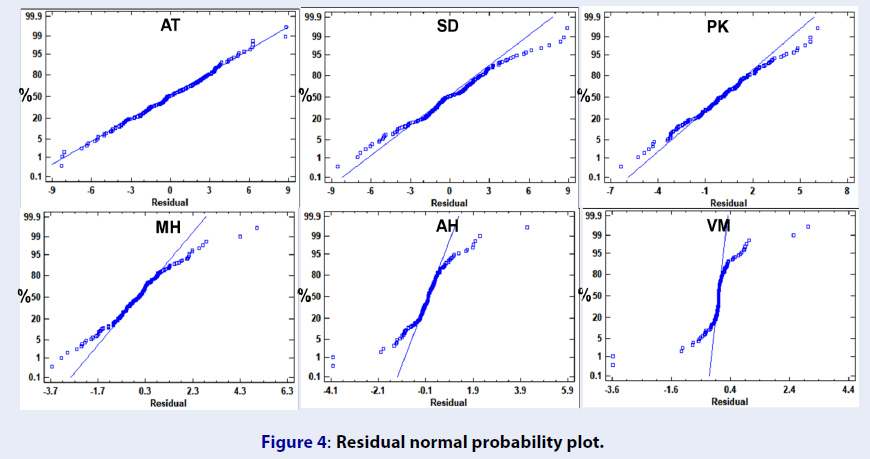
A normal probability plot of the residuals can be displayed in Figure 4. If the residuals come from a normal distribution, they should fall close to the line. In fact, the residual plot in AT, SD, PK, AH showed some curvature away from the line while MH and VM did not.

Residual normal probability plot.
There are five tests have been run to determine whether or not the residuals form a random sequence of numbers. If a p-value for each test is greater than or equal to 0.05, we can not reject the hypothesis that the series is random at the 95.0% or higher confidence level. ARIMA forecasting model in AT, SD, PK, AH passed five tests while MH and VM did not (
Tests for the randomness of residuals. RUNS = Test for excessive runs up and down, RUNM = Test for excessive runs above and below median, AUTO = Ljung-Box test for excessive autocorrelation, MEAN = Test for difference in mean 1st half to 2nd half, VAR = Test for difference in variance 1st half to 2nd half
| Test types | AT | SD | PK | MH | AH | VM |
| RUNS | N.S. | N.S. | N.S. | N.S. | N.S. | N.S. |
| RUNM | N.S. | N.S. | N.S. | N.S. | N.S. | N.S. |
| AUTO | N.S. | N.S. | N.S. | * | N.S. | * |
| MEAN | N.S. | N.S. | N.S. | N.S. | N.S. | N.S. |
| VAR | N.S. | N.S. | N.S. | N.S. | N.S. | * |
DISCUSSION
The perspective view of the saline intrusion in Ham Luong River in 2020 is predicted by the ARIMA model
At the beginning of the dry season (January), the saltwater levels of 10‰ will have occurred in a location where between Mo Cay Nam and Thanh Phu District, over 50 km away from Ham Luong estuary. Also, the saltwater levels from 5-10‰ will cover almost all of Giong Trom and half of Mo Cay Nam District. These districts in upstream such as Chau Thanh and Cho Lach District will be covered by under 2‰ (Figure 5A). Subsequently, at the driest month (February and March), saltwater will be intruded into an area within 60-70 km from the mouth of HLR; therefore all of Giong Trom and Mo Cay Nam District will be affected with the saltwater rate 10‰. Ben Tre City and a small part of Chau Thanh District will be covered by under 5‰ (Figure 5B, C). Finally, at the beginning of the rainy season (early June), saltwater will be pushed away from the inland. The saltwater levels of 10‰ will be observed in Ba Tri District, approximately 10km away from the estuary (Figure 5F).

The interpolation map showed the forecast of saline intrusion in Ham Luong River. (A) January, (B) February, (C) March, (D) April, (E) May, (F) June.
Based on the forecasting results of the ARIMA model, saltwater with 5‰ will be entered up to 60-70 km deep inland that means Ben Tre city (areas with the highest population) and Chau Thanh District (areas with large-scale fruit production) seems to be affected by SI. Outcomes of this study are useful for reducing damages caused by the saline intrusion in the Mekong Delta, also BTP in saline season 2020.
The ARIMA model: advantages and disadvantages
Forecast is an activity to calculate or predict future events or situations, usually as a result of rational study or analysis of suitable data21. The accurate information for saline forecast will become more and more difficult to predict due to climate change and extreme weather22. In recent years, there are several quantitative forecast techniques available such as ARIMA models, Random walk models, Trend models, or Exponential Smoothing. Generally, ARIMA models are considered as statistical theory and mathematically complex techniques while the others are defined as simple prediction techniques. Therefore, the ARIMA model has been regarded as the most efficient prediction technique in hydrology12. In the empirical research, many advantages of the ARIMA model were found and support it as a proper way in especially short-term time series forecasting23. The ARIMA model requires fewer the prior data inputs to generalize the forecast., only needs endogenous variables and does not need to use other exogenous variables. Basically, this model is relatively more robust and efficient than other complex structural models in relation to short-run predictions24. However, the main limitation of ARIMA is the lack of a deterministic cause25. In addition, many traditional techniques for time series forecast, such as ARIMA, which assume that the series is generated from linear processes and as a result might be inappropriate for most real-world problems that are nonlinear27, 26. This problem has now been circumvented through large numbers of past data inputs, stochastic events, and the accuracy of past data inputs that must be enhanced.
CONCLUSION
This paper presents a new approach to forecasting the SI in HLR of the Mekong River systems based on ARIMA forecasting model. Our result showed that the nonseasonal/seasonal ARIMA (0,1,1)x(0,1,1)23 model has been applied successfully for the forecasting of SI in HLR. However, the ARIMA forecasting model in AH and VM could be improved upon by other forecasting methods or still ARIMA with other parameters. ARIMA model with its convenience, accurate forecasting, low data input requirement, and simple computational process, it is bound to obtain a good picture of the prediction of SI over the main river. This makes the analytical model a powerful tool to guide future adaptation management on climate change and also SI in the Mekong Delta.
LIST OF ABBREVIATIONS
AH: An Hiep
ANN: Artificial Neural Network
ARIMA: Auto regressive integrated moving average
AT: An Thuan
AUTO: Ljung-Box test for excessive autocorrelation
BTHMFC: Ben Tre Province’s Hydro-Meteorological Forecasting Center
BTP: Ben Tre Province
CI: Confidence interval
HLR: Ham Luong River
IDW: Inverse Distance Weighting
MAE: Mean absolute error
MAPE: Mean absolute percentage error
ME: Mean error
MEAN: Test for difference in mean 1half to 2 half
MH: My Hoa
MPE: Mean percentage error
PK: Phu Khanh
RMSE: Root mean squared error
RUNM: Test for excessive runs above and below median
RUNS: Test for excessive runs up and down
SD: Son Doc
SI: Saline intrusion
VAR: Test for difference in variance 1st half to 2nd half
VM: Vam Mon
COMPETING INTERESTS
The authors declare that they have no conflicts of interest.
AUTHORS’ CONTRIBUTIONS
Thai Thanh Tran has contributed to collections, analyses, interpretation of data, and writing the manuscript. Luong Duc Thien has contributed to mapping visualizations and interpolation techniques. Ngo Xuan Quang and Lam Van Tan have supported data analyses and revising the manuscript.
Acknowledgements
This research was funded by Vietnam National Foundation for Science and Technology Development (NAFOSTED) under grant number 106.06-2019.51. Moreover, we are particularly grateful to editors and anonymous referees, who kindly provided the constructive and critical reviews of our manuscript.