

Highly efficient sers performance from the silver nanoparticles/graphene nanoribbons/ cellulose paper
- Faculty of Physics and Engineering Physics, VNUHCM-University of Science
- Saigon Hitech Park Labs
- Ntherma Corporation
Abstract
Introduction: Metal/graphene heterojunction structure has been one of the most crucial tools in the growth of high-performance Surface-enhanced Raman spectroscopy (SERS) platform, which is appropriate for sensing applications. In this research, we developed a SERS platform, graphene nanoribbons (GNRs) decorated silver nanoparticles (AgNPs) on cellulose paper substrate, in which GNRs was synthesized by wet chemical based on unzipping process of Multi-walled carbon nanotubes (MWCNTs), then GNRs hybridized with AgNPs through magnetron sputtering method.
Methods: The morphology of graphene nanoribbons coated-Ag (AgNPs@GNRs) was analyzed by field emission scanning electronic microscopy (FESEM) and transmission electron microscopy (TEM). The quality and thermal stability of GNRs were characterized using thermogravimetric analysis. Besides, its structure and quality were also characterized by Raman spectroscope.
Results: The results show that the unzipping process of MWCNTs to form GNRs was strongly affected by dispersing time and stirring temperature. The suitable condition creating the Graphene Nanoribbons using MWCNTs was the dispersing time of 10 mins in an acid environment, stirring in 30 mins at room temperature and in 45 min at 100°C. Moreover, SERS platform of AgNPs@GNRs exhibit the outstanding SERS signal enhancement with rhodamine 6G (R6G) low concentration of 10-5 M compared with pristine graphene and silver thin film. This could be attributed to the synergistic effect between AgNPs, GNRs and analyze molecules based on the enhancement of electromagnetic mechanism (EM) and chemical mechanism (CM), which plays a vital role in promoting the improvement SERS behavior.
Conclusion: Ag NPs assembled onto graphene nanoribbons/ cellulose paper substrate could also serve as SERS active substrates for practical applications in various fields at trace levels.
INTRODUCTION
Raman spectroscopy is one of the techniques to detect molecules and provide their structural information based on the vibration energy levels of analytical molecules. However, it has some drawbacks such as the low scattering cross-section, the weak intensity of Raman signals, resulting in limitation in applications for detecting the low concentration of species. Many pathways which could improve the Raman signals have been proposed. In the 1970s, the Surface-Enhanced Raman Scattering (SERS) was developed 1, 2 and became one of the important analytical tools involving in the interaction between analytical molecules and a typical rough nobel nanostructured metal surface leading a significant enhancement of the Raman scattering intensity.
Although the significant SERS substrate enhancement has been observed, however, there are now still arguments about their enhancement mechanism 3, 4. In recent years, SERS performance based on the enhancement of electromagnetic mechanism (EM) and chemical mechanism (CM) has attracted the widespread concern of researchers. First, EM plays a significant role in enhancing the sensitivity of SERS platform based on the localized surface plasmon resonance (LSPR) when the incident light interacts with the nanostructured metal surface, which generates the local electromagnetic field. It is usually called a “hot spot” and is one of the most factors for being responsible for improving the SERS performance. As a result, the enhancement factor (EF) for this mechanism can reach 10 – 105, 6, 7, 8. The LSPR depends on the size, shape of nanoparticles, density, and gaps, which will affect the cross-section of Raman scattering 9, 10. Second, the CM is associate with the charge transfer between the adsorbed molecule and the SERS substrate. In the charge transfer process, if the increasing separation of positive and negative charge in the molecule is observed, resulting in increasing the cross-section of Raman scattering. The CM is often difficult to observe because it exhibits in a short time, and the EF can obtain from 10 – 106, 7, 8.
Graphene is a monolayer of sp bonded carbon atoms packed into a honeycomb-like crystalline structure. It has wonderful physical and chemical properties such as thermal, chemical, electrical, mechanical and considers as a potential candidate for practical applications. It has a large surface area, superior molecule adsorption ability 11. Furthermore, it can quench the photoluminescence of fluorescent dyes, indicating the fluorescence background of analyzing molecules in SERS measurement can eliminate. Graphene nanoribbons (GNRs) are a member of the graphene family, 1D ribbons with widths in the nanometer range and length in the micrometer, exhibits a variety of electronic properties based on its structure 12. Itself graphene does not consider as a good candidate for SERS because it has the low cross-section Raman scattering 13. The first observation of graphene material for SERS was reported by Ling and coworkers in 2010 14. He reported that the GERS (Graphene-based SERS) showed an excellent charge transfer in SERS substrate. The phthalocyanine (Pc), rhodamine 6G (R6G), protoporphyrin IX (PPP) were deposited on graphene as a submonolayer. The highest occupied molecular orbital (HOMO) and lowest unoccupied molecular orbital (LUMO) of these molecules stand on the two sides of the Fermi levels of graphene. Therefore, the CM is generated due to the occurrence of charge transfer between graphene and the molecules. However, the EF of CM is small to improve the SERS performance. This means graphene should cooperate with the noble metal nanoparticles (Au, Ag) for improving the Raman intensity 15, 16. Furthermore, Ag NPs incorporating graphene can be avoided by the corrosion and oxidizing process, suggesting that the stability of SERS substrate could improve significantly.
Up to now, a lot of graphene-based substrates have been developed and used widely for the SERS platform with ultrasensitive, reproducible, and stable as well. Depend on the role of graphene material, we can classify graphene-metal substrates into four categories: a) graphene as matrix-supported metal nanostructures substrates, b) graphene as shield covered metal nanostructures substrates, c) graphene as sub-nanospacer separated metal nanostructures substrates and d) graphene as both the bottom platform and top shield sandwiched metal nanostructures substrates 13. Among them, the first approach, which involves metal nanoparticles is inexpensive and convenient, is directly grown onto graphene sheets and has been attracted widespread attention. Hsu and Chen et al. 17 fabricated Ag NPs/rGO (reduced Graphene Oxide) using a microwave-assisted technique to detect 4-aminothiophenol (4-ATP) with a low concentration of 10 M, and the EF value obtained 1.27×10. While Caires et al. reported that the Au NRs (nanorods)/GO hybrids structure could analyze the Cresyl Violet perchlorate (CVP) molecule with a detection limitation of 10 M and the EF value of 10 obtained 18. Liang et al. showed that Au NPs sputtered onto the Graphene layer grown on by CVD method to detect adenine molecule with a limitation of 10 M 19. Fu et al. reported that the sensitivity of Ag NPs deposited onto rGO was more 10-fold higher than that of the flat graphene-Au NPs for detecting Rhodamine 6G (R6G) molecule 20. Although the approaches, as mentioned above, have good results for SERS performance. However, these substrates almost have been experienced the multiple steps to fabricate, time-consuming. Particularly, they are difficult to large scale samples that meet the requirement of promising applications.
For the above reasons, a simple approach fabricating the AgNPs/Graphene Nanoribbons/Cellulose paper substrate with a large scale, uniform surface, and flexibility for detecting Rhodamine 6G (R6G) molecule at low concentration has been processed. Therefore, in this research, the Graphene Nanoribbons are made via wet chemical method using raw MWCNTs, then they are deposited onto cellulose paper via vacuum filtration. Finally, Ag NPs were decorated on Graphene Nanoribbons/Cellulose paper substrate by magnetron sputtering method controlling the distance, distribution, and size of these Ag NPs. Their SERS performance was carried out by cutting it into small pieces to evaluate the detection capability of R6G molecules.
EXPERIMENT
Materials
The multi-walled carbon nanotubes (MWCNTs, Ntherma Corp, USA), Potassium permanganate (KMnO, Sigma-Aldrich, ≥ 99%), Sulfuric acid (HSO 99.999%, Sigma-Aldrich), Hydrogen peroxide (HO,50%,Solvay, Thailand), Isopropanol (IPA,(CH)CHOH, 99.5%, Sigma-Aldrich ), Ag target (99.99% pure, Singapore Advantech), Whatman Grade 589 Cellulose paper (Sigma-Aldrich) and Rhodamine 6G dye (R6G, CHNOCl, 99%, Sigma-Aldrich) were used. Analytical reagents were used as received without any further purification. All of the aqueous solutions were prepared using de-ionized (DI) water.
Fabrication
Fabrication the Graphene Nanoribbons (GNRs)
GNRs were successfully fabricated via a wet chemical method. The detailed preparation process is described in Figure 1.
Firstly, 1.5 g MWCNTs powder was added into 400 ml of HSO 98%. The mixture was stirred in 20 minutes. Then, 7.5 g KMnO was added to the solution and continuously stirred in 1 hour at room temperature. After that, the solution was cooled down under 10°C, followed by the addition of HO solution (20 ml, 50%) and stirred progressively. When the reaction was finished, this solution was washed with DI water and filtered using the filter paper. Finally, the sample was dried in a vacuum oven in 12 hours.

The schematic for the fabrication of Graphene Nanoribbons.
Preparation of Ag NPs/ Graphene Nanoribbons/ Cellulose paper substrate (Ag/GNRs/CP)
0.1g Graphene Nanoribbons were dispersed into 500 ml of IPA by high power ultrasonication. This solution was poured into the vacuum filtration system to make Graphene paper and then coated Ag NPs onto it by a sputtering technique. Sputtering time was 10 seconds in Ar environment with a total pressure of approximately 2.2 mTorr and a power 11W as our previous work 21. The preparation process is described in Figure 2.
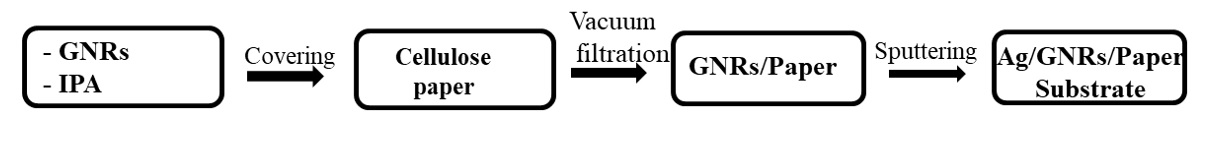
The process fabrication of AgNPs/ Graphene Nanoribbons/ Cellulose paper.
Characterization
The surface morphology and structure of the samples were characterized by Field-Emission Scanning Electron Microscopy (FESEM, Hitachi, S-4800), Transmission Electron Microscopy (TEM, Jeol JEM1400 and JEM1010). The Thermo Gravimetric Analysis (TGA, TG-DSC 1600, Labsys Evo) technique was used to define the quality and thermal stability of Graphene Nanoribbons. The characteristic peaks of Graphene Nanoribbons were evaluated by the Raman spectroscopy (Labram 300, Horiba Jobin Yvon).
SERS measurements
Raman spectra were collected using a Horiba XploRA PLUS Raman system with a 532 nm laser, power of 1.5 mW, and an objective with 100x magnification. The Rhodamine 6G (R6G) molecule is chosen to analyze and dissolved into DI water. Then the R6G solution was dropped onto GNRs, Ag NPs and Ag NPs/GNRs substrates, respectively, and dried in air. Each spectrum was obtained with acquisition time 1 second on 2 accumulation spots and repeated three times in various positions in the wavenumber range 500 – 2000 cm.
RESULTS
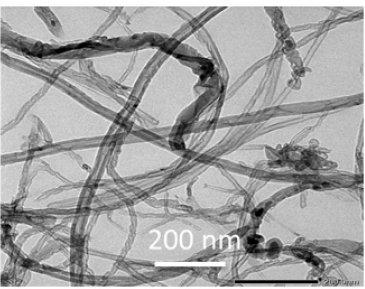
Figure 3 (a and b) showed the FESEM and TEM images of raw MWCNTs from the supplier with the diameter in the range of 8-15 nm. Furthermore, they exhibited Raman peaks characteristic at D-peak (1350 cm) and G-peak (1580 cm) (Figure 3c) and were extremely purity (+ 99% C) (Figure 3d) which played an important factor in affecting the final graphene Nanoribbons product.
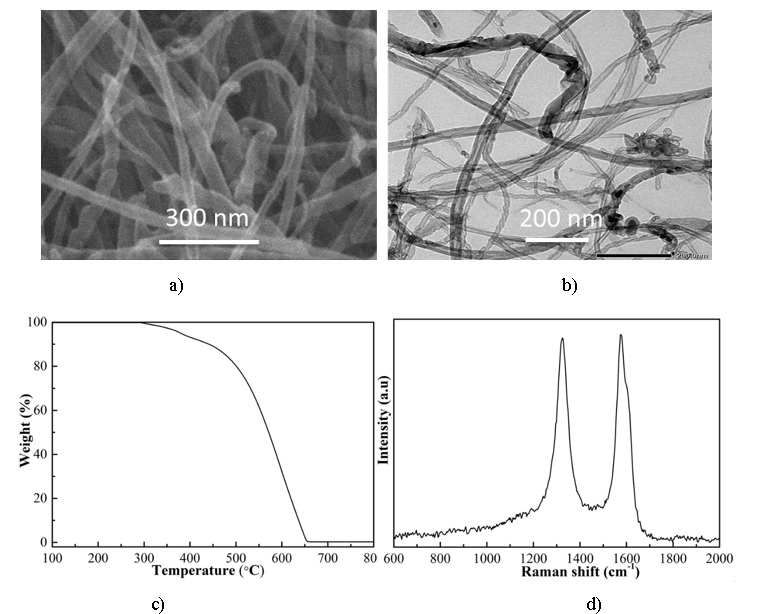
(a, b) the FESEM – TEM images, (c, d) TGA spectroscopy and Raman spectroscopy of raw MWCNTs.
After being dispersed the MWCNTs in acid solution, the morphological characteristics of MWCNTs remained stable without damaging, as shown in Figure 4. Besides, these sample's purity was at + 99% C, and their structure was consistent with two Raman peaks at D-peak (1350 cm ) and G-peak ( 1580 cm) as shown in Figure 5(a and b), respectively. The acid solution is a good environment for dispersing them and reacting in the next steps. Thus, dispersing time was 10 mins to get a well-dispersed solution.

(A, B) the FESEM - TEM of MWCNTs dispersing in acid in different times a) 5 mins, b) 10 mins, c) 15 mins and d) 20 mins, respectively.

(a, b) the TGA and Raman spectroscopes of MWCNTs dispersing in acid at different times.
(A, B) the FESEM - TEM of Graphene Nanoribbons samples in reaction at room temperature in different times a) 15 mins, b) 30 mins, c) 45 mins and d) 60 mins, respectively.
After dispersing MWCNTs into the acid environment, KMnO salt was added slowly and constantly stirred. Oxidation reaction occurred, and Graphene Nanoribbons were gradually formed (Figure 6). However, MWCNTs were unzipped at some outer walls and reached the unzipping saturation at a reaction time of 30 mins. Then the stirring temperature was increased to accelerate the reaction to get full unzip of MWCNTs.

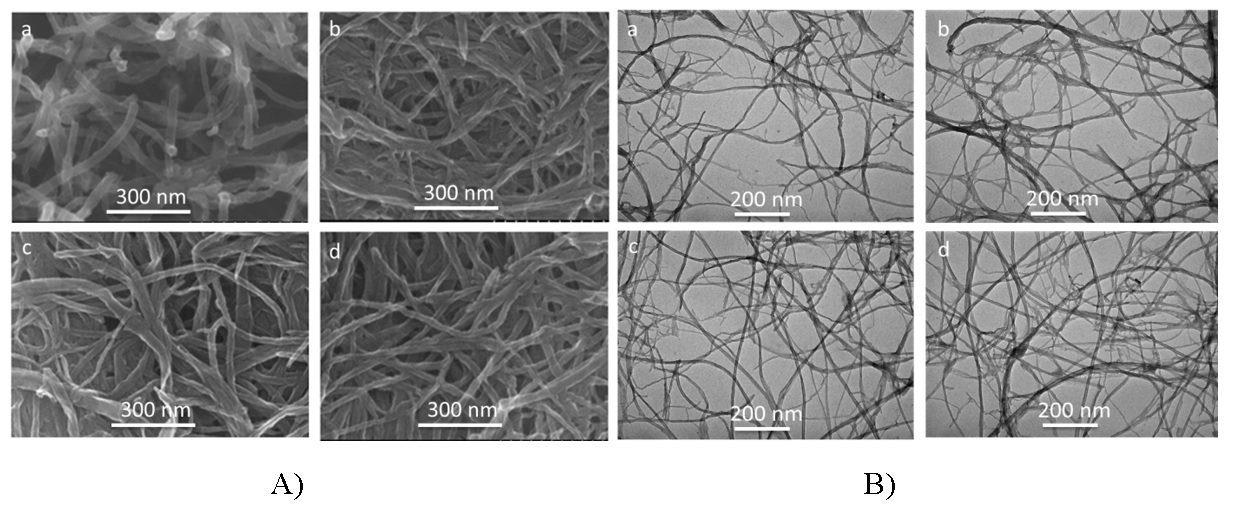
(A) the FESEM, (B) TEM of Graphene Nanoribbons samples in reaction at 100oC in different times a) 15 mins, b) 30 mins, c) 45 mins and d) 60 mins, respectively.
The reaction was performed at temperatures 100C in 1 hour to investigate the ability to unzip MWCNTs to form Graphene Nanoribbons. The experiments did not make over 100°C to avoid evaporating the solution in the reaction. At high temperature, the unzipping MWCNTs increases (Figure 7). This is consistent with the results 22, 23. Especially, the reaction at 100°C in time conditions of 15, 30, and 45 mins, the Graphene Nanoribbons images are very clear, almost walls of MWCNTs were unzipped while in 60 mins the Graphene Nanoplatelets were formed (Figure 7B). All these samples are high purity (+ 99% C) (Figure 8a), showing their quality is good and satisfiable for Graphene paper and SERS application as well. In stirring time 60 mins, in Raman spectrum, the ratio I/I > 1 demonstrating that this sample is more defects, while in 15, 30, and 45 mins, the ratio I/I < 1 showing the good crystallization (Figure 8b). Furthermore, Graphene Nanoplatelets will not be suitable in the next step to make the free-standing Graphene paper because they are tiny flakes that can not grid together. The best reaction condition for Graphene Nanoribbons in this work is 45 mins and 100°C. It is also a condition for the next steps to make Graphene paper and decorate Ag NPs as well.
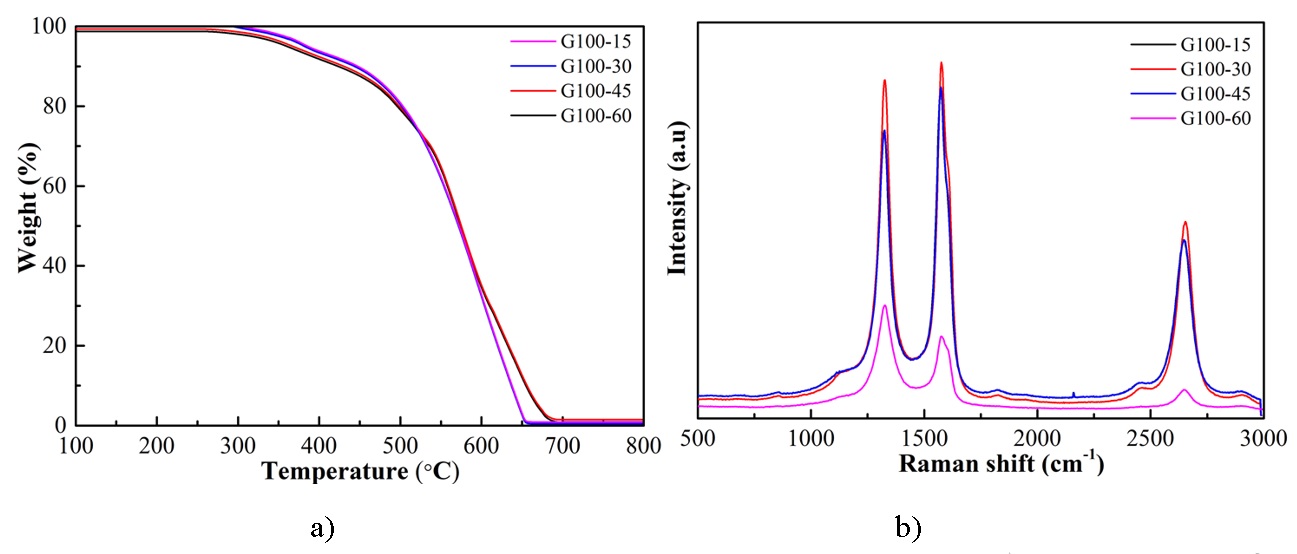
(a,b) The TGA and Raman spectroscopy of Graphene Nanoribbons samples in reaction at 100 C at different times.
The Graphene paper is fabricated with the same process in our previous work 24. Besides, the procedure for Ag NPs was anchored onto the GNRs paper via the sputtering technique as in previous work 21. The result shows that the Ag NPs distributed onto GNRs surface with a uniform diameter under 20 nm, no agglomeration with interparticle distances (nanogaps) about 2-5 nm (Figure 8). Especially, no agglomeration is observed in the SEM image, resulting in having the strong electric field distribution, which is important in the performance of SERS substrate. Furthermore, the surface of the sample is clean because there are not any extraordinary substances. It is ideal for identifying the typical signals of R6G molecule.

The Ag NPs coating onto Graphene paper using a sputtering technique.
Herein, the SERS behaviors of GNRs, AgNPs, and Ag/GNRs/CP, which were used as SERS substrates were examined using Rhodamine 6G (R6G) as a target molecule under the excitation wavelength of 532 nm. In Figure 10, the typical peaks of R6G onto GNRs, Ag NPs, and Ag NPs/ GNRs substrates were shown. They are 612 cm, 775 cm, 1181 cm, 1311 cm (1363, 1511, and 1651 cm), and 1575 cm could be due to C-C-C ring in-plane, C-H out-plane bending, C-H in-plane bending, C-O-C stretching, C-C stretching of the aromatic ring, and C¼O stretching, respectively 25, 26. To the GNRs substrate, the Raman signal of R6G at peaks 612, 775, 1181, and 1651 cm can be distinguishable while 1131, 1363, 1151, and 1575 cm peaks are weak signals. With Ag NPs substrate, the Raman signal of R6G at peaks 612, 775, 1181, 1363, 1151, and 1651 cm are clear while peaks 1131 and 1575 cm are dim. However, when the Ag NPs/GNRs substrate is used, the Raman signal intensity of R6G at all peaks is increased and enhanced significantly. This is explained that there is a combination of both EM and CM. The EM occurs when the Ag NPs play as hot spots that generate the surface plasmon under the excitation of the incident light. While the CM associates the charge-transfer transitions between the Fermi level of the Ag, GNRs, and R6G molecules. This suggests that the Ag/GNRs/CP platform becomes a favorable substrate for SERS applications.

The SERS behavior spectra of the R6G molecules on the GNRs, Ag NPs, and Ag NPs/GNRs substrates.
DISCUSSION
The GNRs formation from MWCNTs was investigated. Firstly, the MWCNTs were dispersed into HSO acid, and this showed that the stirring time did not affect the quality of MWCNTs in the acid environment. It means that the MWCNTs did not be almost shortened or damaged (Figure 4). Then, at the room temperature, the MWCNTs initially seemed to be unzipped some outer layers (Figure 6).
Tour et al. 22 gave the mechanism of unzipping CNTs based on the oxidation of alkenes by permanganate in acid medium. Firstly, the manganate ester was formed (2,Figure 11 b) and could induce the dione (a molecule containing the ketones group) in the dehydrating medium. Next, the ketones group distorted the β-γ alkenes (3,Figure 11 b), and they activated easily with permanganate. When the process continued, the buttressing-induced strain on the β-γ alkenes increased (4,Figure 11 b), and it broadens the space for carbonyl. As a result, the strain is induced by the enlarging hole on the CNTs. Finally, the unzipping process of CNTs was initiated to open to the graphene nanoribbons (5,Figure 11 b), and it was described in Figure 11.

a) The scheme of the unzipping of one wall of a carbon nanotube to form a nanoribbon and b) The proposed mechanism for unzipping of nanotube
Furthermore, Tour et al. 22 suggested the optimal weight ratio between MWCNTs/KMnO = 1/5 and stirring time of 1 hour at 55-70 C in the reaction and could obtain 100% yield of nanoribbon structures. While Dimiev et at 23 suggested that the optimal weight ratio between MWCNTs/KMnO = 1/3 could achieve the highest GNRs formation. However, the time or temperature of the reaction was not recorded. In this study, the stirring time from 15 to 60 mins at a temperature of 100C, we can get the highest GNRs formation at the stirring time of 45 mins and a temperature of 100C. (Figure 8b). Therefore, this will affect the quality of both Graphene paper and SERS performance as well.
Goul et al.15 showed that graphene has fabricated using a chemical vapor deposition (CVD) method and incorporated with gold nanoparticles (AuNPs) by e-beam evaporation method. This SERS substrate could detect R6G with a low concentration of about 8×10 M. He reported that the graphene contributed to the enhancement of SERS performance from based on a charge-transfer mechanism related to the EM and CM mechanism. Moreover, Zhou et al. 16 revealed that the EF of rhodamine 6G molecules only obtained 5.6 × 10 due to the presence of the Ag NPs aggregates in this SERS structure. Hsu et al. 17 reported that Ag/reduced graphene oxide substrate was prepared by the microwave-assisted green synthesis. The Ag/reduced graphene oxide substrate was used to analyze the 4-aminothiophenol (4-ATP) molecules with limitation detection about 10 M, and EF value was 1.27 × 10. All the above studies talked about the enhancement of the Raman scattering signals with the contribution of graphene via a charge-transfer phenomenon and surface plasmon resonance of noble metal nanoparticles (Ag, Au NPs). In our study, the SERS structure contains both graphene nanoribbons and silver nanoparticles. The target is to detect R6G molecules at low concentrations. The SERS performance of Ag/GNRs/CP substrate exhibits a remarkably high enhanced Raman intensity compared with that of AgNPs and GNRs substrate. It could be noticed that combine the properties of GNRs and AgNPs plays an important role in the enhancement of the Raman scattering signal.
CONCLUSION
A simple pathway to fabricate the Silver nanoparticles/Graphene Nanoribbons/ Cellulose paper toward Surface-Enhanced Raman Spectroscopy application is presented in this work. The process for Graphene Nanoribbons formation is investigated in detail, including the disperse MWCNTs in acid, unzipping process at room temperature, high temperature at various times. We suggest that the suitable conditions to create the Graphene Nanoribbons using MWCNTs for SERS platform were stirring in 45 mins at 100C. Moreover, the SERS performance of each AgNPs, GNRs, and Ag/GNRs platform was also reported. The SERS substrate with a uniform diameter of Ag NPs and no agglomeration exhibited a significant Raman intensity enhancement of the R6G molecule detection with the Ag NPs/GNRs substrate. This work presents a facile route to fabricate the SERS platform with high flexibility and sensitivity. The SERS substrate could offer a new approach for the detection of trace species in biochemical research and environmental monitoring.
ABBREVIATIONS
GNRs: Graphene Nanoribbons
MWCNTs: Multi-walled carbon nanotubes
Ag NPs: Silver nanoparticles
SERS: Surface-enhanced Raman spectroscopy
EM: Electromagnetic mechanism
CM: Chemical mechanism
LSPR: Localized surface plasmon resonance
R6G: Rhodamine 6G
COMPETING INTERESTS
The author(s) declare that they have no competing interests.
AUTHOR’S CONTRIBUTION
Tieu Tu Doanh has conceived of the present idea, carried out and written the manuscript with support from Vu Thi Hanh Tu, Nguyen Van Cattien.
Tieu Tu Doanh, Thai Duong, Nguyen Cong Danh and Ton Nu Quynh Trang carried out the experiments in group.
Ton Nu Quynh Trang and Ngo Vo Ke Thanh have supported the analysis techniques.
ACKNOWLEDGEMENTS
This research is funded by the Saigon Hitech Park Labs, under grant number NVTXTCN 7/2020.