

Effect of the chemical vapor deposition condition on the electrochemically catalytic efficiency for hydrogen evolution reaction in MoS2 nanoparticles
- Department of Physics, Faculty of Basic-Fundamental Sciences, Viet Nam Maritime University, 484 Lach Tray Road, Le Chan, Hai Phong, Viet Nam
Abstract
Introduction: Using the metal organic chemical vapor deposition (MOCVD) method, we have synthesized the MoS2 nanoparticles on graphite foil substrates employed as the electrochemical working electrodes with highly efficient electrocatalysis for hydrogen evolution reaction (HER).
Methods: The morphological and structural properties of the as-grown MoS2 materials were demonstrated by field emission scanning electron microscope (FESEM) and Raman spectroscopies, while their elemental components were investigated by X-ray photoelectron spectroscopy (XPS).
Results: The optimum growth time was acquired to be 11 hours. Thereby such obtained electrode exhibited the maximum HER activity with onset over the potential of 220 mV versus reversible hydrogen electrode (RHE), and the Tafel slope of 66 mV per decade (mV/dec).
Conclusion: Our results suggest a good technique for the research of high-efficient HER electrocatalyst based on atomic-thickness layered materials.
INTRODUCTION
Hydrogen gas, an excellent source of clean energy, has been demonstrated as an ideal replacement for hydrocarbon-based and fossil fuels1, 2. Hydrogen gas can be conveniently yielded from the electrochemical water splitting reaction2, 3, 4. Using this approach, the hydrogen evolution reaction (HER) that happens on a cathode surface can be accelerated by loading an electrocatalyst on it. However, the best electrocatalysts for HER are Pt and its relation noble metals, which has substantially limited their commercial massive production4, 5, 6. Thus, developing low-cost electrocatalysts that possess strong stable and HER performance to be close to Pt-based catalysts is ultimately desirable.
So far, nanostructures of molybdenum disulfide (MoS) have been proven promising candidates for excellent catalytic activity7, 8, 9. Using DFT calculation, J. K. Nørskov’s group first reported that hydrogen adsorption Gibbs free energy of edge sites of MoS is close to zero (ΔG ~ 0 eV), suggesting MoS probably as a great HER catalyst10. The experimental measurements then assured this prediction of HER performance of MoS nanoparticles on graphite10, and Au(111) substrates11. Subsequently, numerous reports have focused on maximizing the exposured active-edge-sites, arming to enhance the HER activity of MoS. These efforts can be the growth of vertical nanoflakes12, nanobelts13, mesoporous14, 15, or nanoparticles16. On the other hand, due to low intrinsic conductivity in MoS, one can reduce the number of layers to minimum the charge transfer resistance between the exposure surface at the outmost layer and the electrode17. In this regard, a small number of layers was demonstrated as another important expect for highly catalytic HER performance in MoSnanostructure. Generally, MoS nanostructure with a small number of layers (around 2~4 layers) might be a great alternative of noble-metal-based HER electrocatalysts. However, synthesis a large scale of few-layer MoS nanostructure directly on conductive substantial has been still difficult18.
Here, we used the MOCVD technique to grow MoS nanoparticles directly on conductive graphite, which was applied for HER electrochemical working electrode. This work focused on the dependence of HER performance on the MOCVD growing condition, particularly the growth time. We found the sample grown in 11h to exhibit the highest HER activity with the smallest onset overpotential of 250 mV/dec, and the Tafel slope of 66 mV/dec.
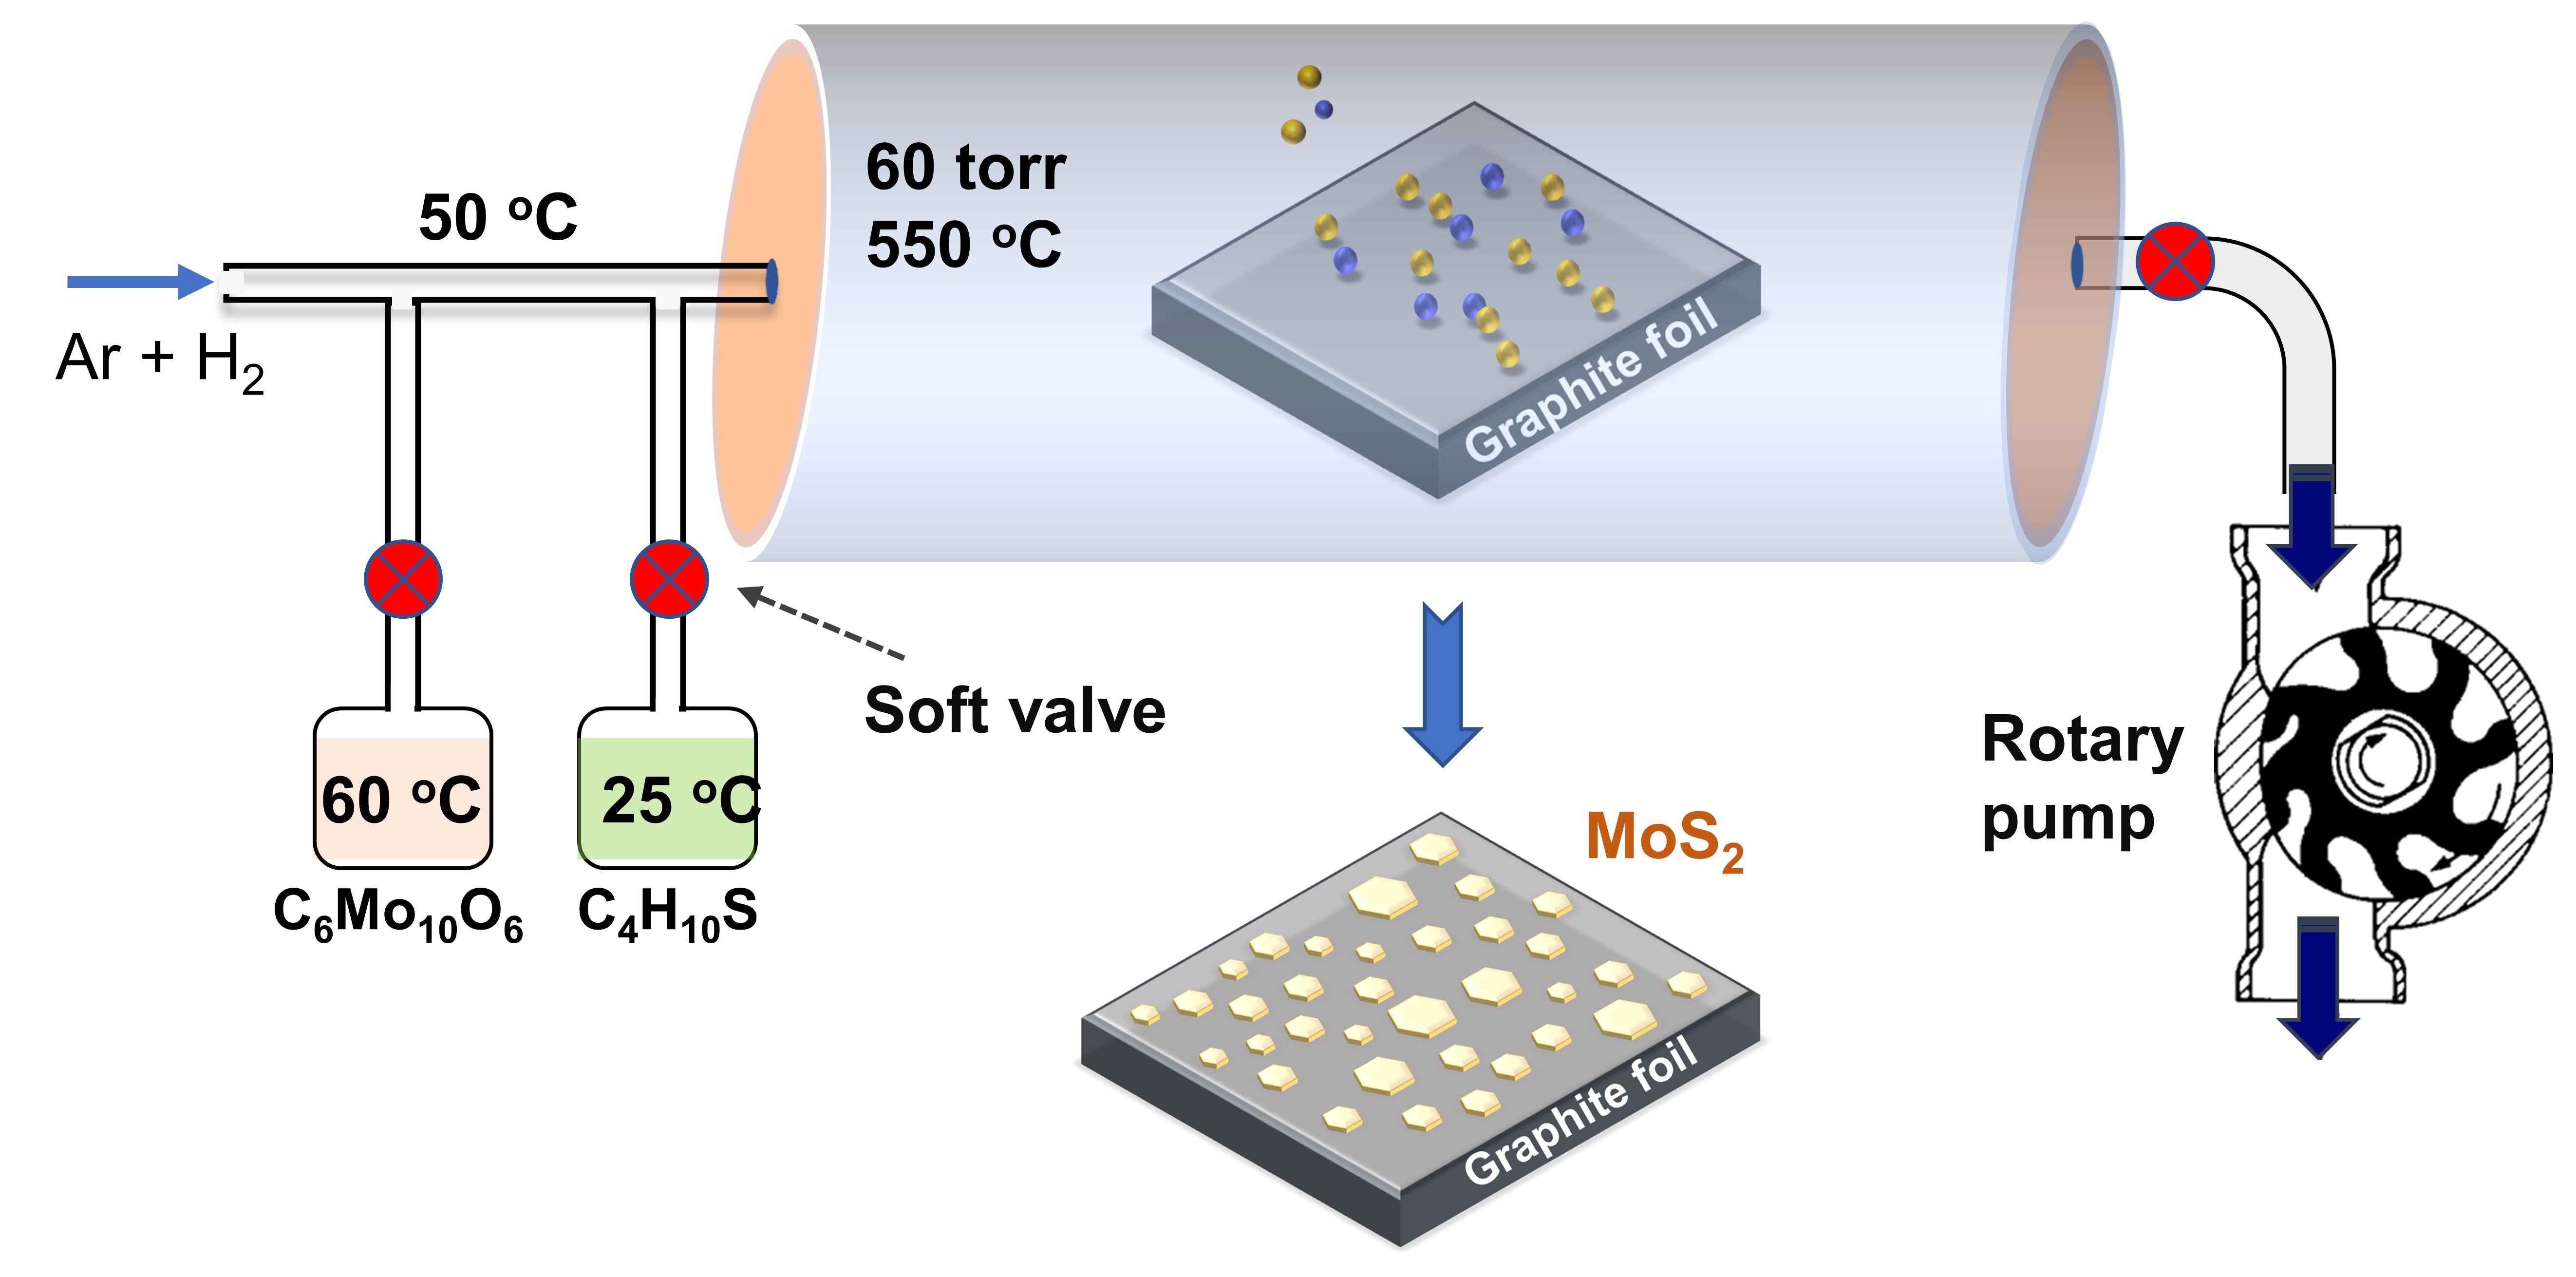
Schematic illustrationof MOCVD system growing MoS2 nanoparticles.
MATERIALS - METHODS
Synthesis of MoS nanoparticles
MoS nanoparticles were synthesized via MOCVD, as schematically illustrated in Figure 1. Briefly, the experiment was taken place in a sealed 1-inch diameter quartz tube, and then graphite foil electrodes were placed at the center of the heated zone. The metal-organic compound of molybdenum hexacarbonyl (MHC, CMoO) and diethyl sulfide (DES, CHS) have high equilibrium vapor pressure were used as the gaseous precursors. Firstly, the base vacuum (~1 mtorr) was established in the chamber by a rotary pump. At the same time, the temperature of MHC and DES bearer was adapted at 25C and 60C, respectively. Then, a flow of 1 standard cubic centimeter per minute (sccm) of Ar gas was injected into DES bearer to dilution and thus facilitated the DES vapor flow. The temperature of the carrier line was fixed at 50 C, and that of the reaction zone was 550C. A mixture of 30 sccm of Ar and 5 sccm of H was continuously flowed into the reaction chamber during all growing processes to maintain the working pressure to be 60 torrs. Subsequently, the reaction process was started by introducing 1 sccm mix of (Ar + DES) and open soft valve of the MHC holder. For a comparative investigation of HER reactivity, MoS samples were synthesized with various deposition times of 7, 9, 11, 13 h by a similar deposition condition.
Characterization
The morphology of MoS samples was characterized by field-emission scanning electron microscopy (JSM-6500F, JEOL). The lattice vibrational properties were investigated by micro-Raman spectroscopy using a 473 nm excitation source under ambient conditions. The X-ray photoelectron spectroscopy (XPS) measurements were carried out using a Theta Prove AR-XPS System (Thermo Fisher Scientific).
HER measurements
The three electrodes configuration, including graphite rod (i.e., counter electrode), Ag/AgCl (i.e., reference electrode), and MoS nanoparticles on graphite foil (i.e., working electrode) was employed to plot the linear sweep voltammetry (LSV) and cyclic voltammetry (CV). All the electrochemical measurement was put in a 0.5 M HSO electrolyte and was established in an electrochemical workstation (IviumStat, Ivium Tech) to study the HER reactivity.

Morphological analysis. FESEM images of baregraphite foil (a), and MoS2 nanoparticles (b-f) synthesized for 6,7, 9, 11, 13 h. The scale bar is 1 μm.
RESULTS
The morphology of MoS nanoparticles was observed by FESEM images, as shown in Figure 2. As shown in Figure 2a and b, the 6h grown sample is similar to the blank substrate, indicating that before 6h, the MoS has not been formed in the substrate. When the growth time reaches 7h (Figure 2c), tiny particles appear with the size of 50-100 nm. According to Figure 2d-f, the density of the nanoparticles increased with the growth time, while the size of particles seems to be not changed.

Raman spectra of MoS2 nanoparticles ongraphite substrate (a). The zoom-in of the Raman spectra of samples grown in 7hto 13h.
Figure 3 shows the Raman spectra of the obtained MoS samples. As shown in Figure 3a, two peaks located at 378.2 and 401.5 are attributed to the two typical active Raman scattering mode of E and A vibrational modes in 2H phase of MoS, in which the first one (E) is attributed to the in-plane vibration of Mo-S bond, while the other one (A) is corresponding to the out-of-plane vibration of S atoms19. Moreover, the frequency separation between these two peaks of 23.5 cm suggested that the number of layers was between 3 and 4 layers17, 20. Although the growth time is much different (alternating between 7h~11h), the number of layers of samples does not change, reflected by the non-shift in the Raman peaks position (Figure 3b).

Chemical composition analysis. The high-resolution XPS spectroscopy of as-grown MoS2 nanoparticles superimposed by fits(red lines) for (a) Mo 3d energy levels range: Mo4+ (olive trace),and Mo6+ (orange trace); (b) S 2p energy levels range: S2- of MoS2 (blue trace).
The X-ray photoelectron spectroscopy (see Figure 4a-b) was constructed to study the elemental bonding states of as-grown MoS nanoparticles. Figure 4a illustrated the high-resolution of XPS spectra in Mo 3d region. As can be seen, the two olive-fitted peaks located at 229.65 and 232.8 eV are corresponding to Mo 3d and Mo 3d energy levels in MoS, respectively 21. Besides, the two small peaks (orange fitted curves) overbed at 231.8, and 235.9 eV are ascribed to the Mo states, indicating the formation of a small amount of molybdenum oxide due to partial oxidation of MHC throughout the deposition process22, 23. Additionally, two blue fitted peaks that were detected at 162.5 and 163.7 eV (see Figure 4b) are attributed to the S 2pand S 2penergy states in MoS, respectively23. Thus, all these data confirmed the chemical elemental composition of the fabricated materials.

Electrocatalytic HER activities of MoS2 nanoparticles. (a, b) iR-corrected LSVs and Tafel plots, respectively. (c, d) Cyclic voltammetry of the 11h sample at various scan rate, and the linearfitting of the average capacitive current density versus the scan rate for MoS2 sample with different growth time, respectively. Stability of the obtained MoS2 sample, (e) Potential vs. time plot, conducted at -5 mA/cm2 for 11hsample, (f) LSVs of the initial 11h sample (magenta) and after applying bias states (dashed black).
The HER performance was firstly examined by the linear sweep voltammetry (i.e., polarization curves), as illustrated in Figure 5a. As can be seen, there was a considerable enhance of HER activity as the CVD growth time increase from 7h to 11h. The 11h sample revealed the highest performance with the onset overpotential of approximately 250 mV vs. RHE, which was considerably smaller than the 7h, 13h, and bare samples. The Tafel plots can also be used to evaluate the electrocatalytic activity for HER, in which the smaller obtained Tafel slope corresponds to the higher HER reactivity. Figure 5b exhibited the corresponding Tafel plots of the MoS nanoparticles synthesized at different times. Even though the 9h sample exhibited a similar onset overpotential with the 11h sample, its Tafel slope of 91 mV/dec was much higher than that of the 11h sample (66 mV/dec). However, when we further expanded the deposition time until 13h, the performance experienced a degeneration with the onset overpotential and the corresponding Tafel slope enlarged to ~350 mV vs. RHE and 88 mV/dec, respectively. Generally, the MoS nanoparticles deposited in 11h exhibited the optimum electrochemically catalytic activity for HER.
To evaluate the density of the active site of catalysts, the cyclic voltammetry (CV) plots in a non-Faradic potential range were conducted at the scan rates changing between 10 and 70 mV/s, as shown in Figure 5c. Then, the double-layer capacitance (C) obtained from the linear fitting the dependance of the average current density versus scan rates (Figure 5d) was demonstrated to be proportional to the active site density24. As can be seen, the 11h sample exhibited the maximum C of 2.21 mF/cm, which is considerably larger than that of the rest ones. Thus, although the morphology and the density of MoS nanoparticles of 11h and 13h samples are almost similar, the former reveals a significantly higher performance than the latter. Nevertheless, these calculations of the electrochemically active surface area of catalysts were well consistent with the above polarization curves.
Finally, the stability test for the HER catalytic activity of 11h sample was investigated by the transient chronopotentiometry measurement with a working current density of -5 mA/cm, as depicted in Figure 5e. During a period of 20h, we observed no significant variation of overpotential, demonstrating great stability. In addition, the nominal modification of polarization curves before and after the durability characterization verified the superior working stability of as-obtained MoS nanoparticles (Figure 5f).
DISCUSSION
As mentioned, the MoS nanoparticles that recently have been considered as a promising candidate for highly efficient electrocatalytic for HER were fabricated. Remarkably, our MOCVD method supported a direct growth of MoS nanoparticles on conductive graphite foil electrodes which simplified the material preparation. The electrode surficial phenomena were tested without any extra transfer process. In this way, it also naturally avoided the electrical loss contacts for the electrochemical measurements. For catalytic HER activity, the electrochemically active sites play an essential role. Frequently, the active sites locate at the edge-sites rather than at the basal plane. As a result, ragged particles in nanoscale size are more favorable than a uniform continuous film. In addition to the morphological aspects, the thickness of MoS material is another essential factor affecting total performance. The layer number ranging from 3 to 4 was demonstrated as the best option for HER reactivity16. Interestingly, the fabricated MoS particles in this work well matched with above requirements.
In this study, under the same reaction temperature, carrier gas concentration, and precursors’ flow rate, the morphology (i.e. size and layer number) of MoS nanoparticles was similar; therefore, the catalytic activities essentially only depended on the density of particles. Meanwhile, the growth time leaded to the change of particle density. Thus, for the samples grown from 7 to 11h, a considerable enhancement in the electrocatalytic activity can be easily understood as extending the density of MoS nanoparticles. However, we assert that a further extending growth time (≥ 13h) should not be employed to acquire the optimum performance. We attributed the best HER performance of 11h samples to the maximum of active site density compared to the other ones, which was then proved by the fact that it has the highest value of electrochemical double-layer capacitance (C). One possible reason for lower performance in the more extended growth sample was a transition from the electrochemical active-Mo-edge sites to the inert S-edge sites through extra growth time25. Such extra growth time might fulfill some S-vacancies existing near the active-Mo-edge sites. This mechanism should be further confirmed in the following research topic.
Finally, although the obtained performance of the present MoS sample was relatively better than that of some previous MoS based materials18, 26, it has been still far from that of Pt-based catalysts (Tafel slope ~30 mV/dec)27. Therefore, some additional works are required to improve current results further. We suggest that the efficiency of MoS nanoparticles can be further enhanced by activating the basal plane of MoS nanoparticles by further applying surficial treatment routes, such as doping, engineering S-vacancies defect positions or hybridization with a high-surface-area substrate.
CONCLUSION
We have reported the method, namely MOCVD, to synthesize MoS nanoparticles applying for the HER electrocatalysis. We found that the deposition time considerably affected the HER efficiency in which the electrochemically active sites density played an essential factor. Particularly, the 11h deposited MoS sample showed the highest active site density, thereby the best HER performance with onset overpotential of 250 mV vs. RHE, and the Tafel slope of 66 mV/dec. Thus, this search may provide a straightforward and convenient route to acquire a good replacement to the Pt-based electrocatalysts.
ABBREVIATIONS
MOCVD: Metal-organic Chemical Vapor Deposition
HER: Hydrogen Evolution Reaction
RHE: Reversible Hydrogen Electrode
MHC: Molybdenum Hexacarbonyl, Mo(CO)
DES: Diethyl Sulfide, (CH)S
FESEM: Field Emission Scanning Electron Microscope
XPS: X-ray Photoelectron Spectroscopy
LSV: Linear Sweep Voltammetry
CV: Cyclic Voltammetry
COMPETING INTERESTS
The authors declare no competing interests
Authors contributions
Q. L. D designed and performed the experiments. D. A. N analyzed data and wrote the manuscript. All authors have given approval to the final version of the manuscript.
ACKNOWLEDGMENTS
This work is funded by Vietnam Maritime University under grant number: “DT20-21.94”.