

Real Estate Image Classification For E-commerce Website
- University Of Science, VNU-HCMC
- University of Science, VNU – HCMC
Abstract
Currently, the image is the most important part of e-commerce websites and has a very significant impact on the real estate industry. In this work, we represent a novel approach for image classification in real estate. This problem can be applied to resolve some automated functions in operating the website when using machine learning algorithms in data-driven approaches. We can find some datasets about real estate images, such as REI and SUN, for this classification problem. However, they do not have images related to ecommerce websites such as TopReal in the Vietnam market. Therefore, we propose a new dataset called REID that is based on real requirements from the TopReal website and the others. This dataset has a hierarchy with 4 generics and 8 specific classes. To this end, we propose two model-based ConvNets for classification problems. In the first model, we design based on the LeNet architecture as in the baseline model to investigate and analyze the dataset for deep understanding. In the second model, we propose a transfer learning-based approach with ResNet as the feature extraction module and SVM as the classifier. The experimental results show that we obtain 97.6% and 87.3% accuracy for classes 4 and 8, respectively, on the REID dataset. These results show that our proposed methods achieve high accuracy on a real estate image dataset that adapts the websites in the Vietnam market and can extend easily to the others. Furthermore, the REID dataset can be extended to resolve many problems in real estate images for the Ecommerce Website.
INTRODUCTION
Currently, real estate is the most developed field for the Vietnamese economy. Many websites are developed in which the properties for selling, buying and leasing. The core modules in the real estate website validate the posted image and tag keywords into the image for search engine optimization (SEO) for each post. In the current study, these functions are evaluated and annotated by human beings. Therefore, we are easy to recognize that if these functions are automated by intelligent agents, it will reduce cost and increase efficiency in the operation system of websites and business models in costing and scaling. In this research, we investigate the image classification problem in computer science with the hope of resolving some aspects based on research from the TopReal website. Moreover, information enhancement from images can be applied to assist brokers or agents in speeding up the process associated with listing, buying, selling and leasing a property.
In recent years, computer vision has become popular and has many applications on real ecommerce websites. Specifically, image classification is a traditional problem and has become successful in recent years1, 2, 3, 4. This problem is resolved by using fusing algorithms from computer vision and machine learning. These algorithms based on machine learning need datasets to learn the samples and increase the performance when inferencing. We can find some benchmark datasets about the real estate industry from the research community. The REI and SUN datasets are used in some previous research and have some promising results3. However, we investigate real estate websites such as TopReal in the Vietnam market (Figure 1). These above datasets do not contain image samples such as legal documents and some noisy images. Therefore, these datasets and algorithms will not work well on our research and ecommerce websites such as TopReal. In this research, we will introduce a new dataset that is extended from REI to solve the data problem. For machine learning and inspired by the success of deep convolutional neural networks in many studies5, 6, 7, 8, we proposed two approaches for image classification: 1) an end-to-end learning model based on the LeNet architecture and 2) a transfer learning model based on the fusion of ResNet and SVM. We will evaluate these models on the REID dataset to demonstrate the performance and the general capacity in classification problems. These results can be applied to validate and label images for each post on the TopReal website. Furthermore, our proposed dataset and algorithms can be easy to extend and apply to other websites or domains in the real estate industry based on image datasets.
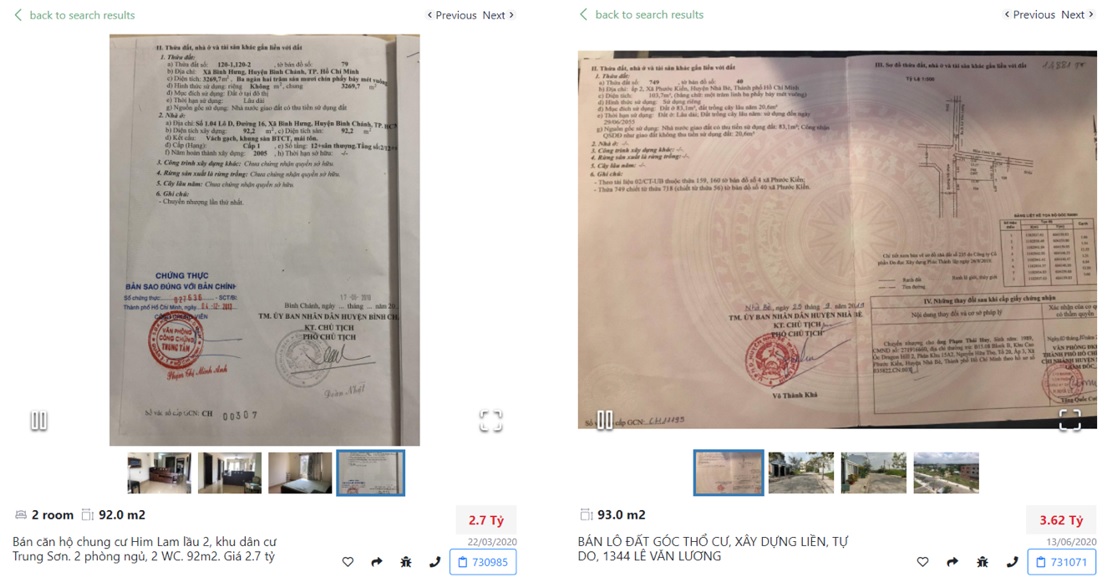
Some examples of document images on the TopReal website (https://topreal.vn)
In summary, our contributions are listed as follows: i) We introduce a new dataset called REID9. This dataset is extended from the REI4 dataset that adapts to the Ecommerce Websites in Vietnam market; ii) we build LeNet-based architecture as a baseline model to evaluate the performance on 4 general classes and 8 specific classes on the REID dataset; iii) we propose a framework that uses transfer learning technology in machine learning. Specifically, we use a ResNet-like feature extraction model, and the SVM is a classifier module. Then, we evaluate this approach on the REDI dataset to show the performance and apply it in real applications.
The rest of the work is organized as follows: in section 2, we review related work that outlines the problems and the requirements based on the limitations of prior work. In section 3, we present our proposed methods for real estate image classification. In section 4, we introduce a REID dataset and show the experimental results from our experiments as well as discuss them. We conclude in section 5.
RELATED WORK
From these years, there has been widespread concern about “multillabeled tagging” in many fields and social networks, especially in Facebook, Instagram, and Twitter. We can understand it roughly by giving an example: With input is a picture, when a model will return some outputs about objects that exist in a picture, such as a chair, table, television or even a person or vehicle running in the street, Restb.ai10 has successfully built “Real Estate Image Tagging” with the ability to categorize 40 types of rooms and 15 scenes outside the house. Multilabel tagging for retrieving images has become a topic of general interest. Since then, we have realized the potential and the ability to scale up for practical demands not only domestically but also widely used abroad. These are the main reasons that motivate us to research this topic.
A group of college students in California, America3, has developed a search to classify real estate images. They use long short-term memory (LSTM) combined with a fully connected neural network, and models tested in the REI and SUN datasets have shown significant relevant results, with 90% accuracy. LSTM stands for Long short-term memory. They are a special kind of neural network called Recurrent Neural Networks (RNN). LSTM increases computational complexity compared to RNNs with the introduction of more parameters to learn, and the presence of several memory cells is the main reason that its required memory is higher than RNNs. Recent studies using convolutional neural networks (ConvNets) have achieved state-of-the-art performance in several tasks, such as classification, regression, image recognition, and image retrieval. There are many types of models we need to consider, but in this paper, we will mention a model using residual networks in section 3.
Research groups in Taiwan11, 12 have implemented a method using a CNN model (using a pretrained model of the ImageNet dataset) to extract features and use parameters to transfer to a fine-tuning model. The output of their model returns an array of hashing binary codes of images from the dataset. After that, they use some image retrieval and deep search to retrieve many images that have similar content. When applying this model for testing in the CIFAR-10 dataset, it gains approximately 89% accuracy in the validation set after 50000 epochs. However, if we want to use these hashing methods, we need to have a binary hash code for learning. These methods require a large amount to describe a similarity between data points in the training set. In contrast, we present work effectively by transfer learning with a support vector machine to categorize a real estate image dataset.
SIFT and SURF13, 14 are algorithms used to extract features from the images. SIFT presents its ability in most situations but still not good in performance. In contrast, due to reductions in computational complexity, SURF’s performance is faster and better. In SIFT, Scale-space is based on the approximating method LoG (Laplace of Gaussian) using DoG (Difference of Gaussian), while SURF uses Box Filter. Therefore, the processing speed will be significantly improved by using integral images. In the Orientation Assignment step, SURF uses the wavelet response in both vertical and horizontal before calculating the main direction by the total of these responses. There is a striking note that the wavelet response can also easily be calculated with the integral image. In addition to the benefits, the SURF algorithm has many drawbacks, such as a high dimensionality of the feature descriptor, a large amount of computation and low matching accuracy when the angle of rotation and angle of view are too large.
In this research, we propose two classification models that have the ability to tag images. In the preprocessing step, all of the dataset images were extracted into representative features. One of the hands, a classification model is proposed to categorize real estate images into 8 classes by the SVM algorithm. On the other hand, another classification model is proposed to categorize real estate images by 2 layers of classification. Both proposed models will be analyzed in detail in the next sections.
METHODOLOGY
Deep learning has become the new de facto model for visual recognition in recent years. In our initial stage, we tried to generalize problems by building our baseline model using a convolutional neural network to categorize our images from the dataset to summarize and select appropriate evaluation metrics. In short, we have concluded that the homemade model does not handle the problems well in some aspects. We also tried a loaf of technique to fine-tuning the model, but it did not provide good results. To address the problems that we are facing, we suggest a method called transfer learning. We used a pretrained model named ResNet50 as a feature extractor by freezing the classification layer. We replace the last layer with another classification method, SVM15, to categorize 6 types of rooms that commonly exist in houses, including living rooms, kitchens, bedrooms, bathrooms, dining rooms, and exteriors, and 2 other classes that were crawled from Google images, such as documents about house ownership certification, identical cards, and other animal images. To handle the images uploaded from users well (there may be some exceptions), we add two extra classes for better classification result purposes. In the first part, we will discuss our baseline model, the use of transfer learning: architecture and special connection of ResNet50, some prior knowledge and other preliminaries.

General proposed framework for real estate image classification based on feature extraction
Our baseline models

Le-Net architecture model with 4 convolutional layers to classify 8 classes
We create our first baseline model by associating some convolution layers and dense layers with a total of 7 layers. Our visualization of the model is described in Figure 3. As we can see in the figure, there are approximately 4 convolution layers. Each layer was added along with a pool layer to downsample the feature maps by summarizing all the features in each feature map. There are two types of pooling layers we can use: average pooling and max pooling. However, in this paper, we prefer to use max pooling to reduce the size of the representation to speed up the computations. After a few convolution layers, we add two more dense layers with 4096 units and a final layer with 8 units and use a softmax activation function.
ResNet50-based approach
There are many types of convolutional neural networks, such as VGG16, AlexNet, ResNet50, DenseNet, and Inception.5, 7, 6, 8, 16. Residual networks were first introduced in1, 16. A deeper neural network is more difficult to train since it can cause vanishing/exploding gradient problems5. Deep neural networks extract features from low to high levels and integrate all level features and classify them. We recommend classification after feature extraction called SVM 15. One of the most striking features that make ResNet50 better than plain networks is the residual block. As we increase the number of layers, the training error tends to decrease, but later, they will return. In theory, having more layers always helps with training errors. However, in practice, having a plain network, instead of ResNet50, our training loss will tend to worsen if we pick up a deep network.
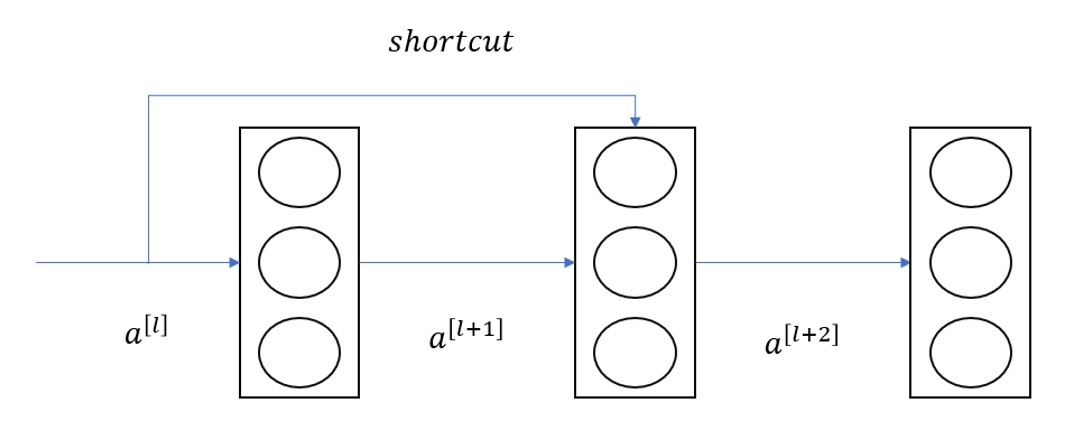
Shortcut connection in ResNet50 architecture
Due to 16, we have many types of ResNet architecture: ResNet34, ResNet50, ResNet101, and ResNet152. In this paper, we prefer to use ResNet50. This section will introduce why ResNet50 can be used in deep networks. We discuss some notation in this section. Assume the activation function in a network is an in a layer called l. In this case, we mention functions such as linear functions (denoted as f), where x denotes the activation of the layers l and b is the bias to obtain a better understanding of this intuition). In this example, let say we have a path like this: We apply linear functions to the activation in layer a and then go to a and finally go to layers a . With the input from layer a, we apply linear functions to obtain this equation: z = Wa +b. After that, we apply RELU nonlinear activations called g to obtain a. In the next layer, we apply the same operations as the previous layers to obtain a. The main path can be designed as shown in Figure 2. With the innovations of ResNet, we can create a “shortcut connection” from layer a to layer a by copy to match further into the neural network and add a before applying it to ReLU. Now the layer a =g(z +a). The way we build ResNet is stacking these blocks to create a deep neural network. The term a =g(z +a) can expand to a =g(Wa + b +a), which is called the identity block and helps copy the identity function from a to a, and this does not hurt the performance at all.
Now, we come deeper into residual network analysis and point out why it can prevent vanishing gradient problems. First, we need to understand what is vanishing gradient problems5, and the backpropagation algorithm is a technique that is widely used in training a network. The general idea is to backpropagate from the deeper layers to earlier layers and compute the gradient of the cost function with each parameter of the network. Then, we use that gradient to update the parameters. All this processes are repeated until the parameters converge. In theory, we will have a hyperparameter called the epoch. If the number of epochs is small, the network is underfitting, and if the epoch is too high, the training time will take a lot of time. However, in practice, gradients will have smaller values when going through deeper layers, which leads to no longer updating, so the algorithm cannot converge. This phenomenon is called the vanishing gradient. With the appearance of ResNet, we can handle this very well. Denoting the loss function as E, based on the chained rule backpropagation, we have this expression:
This equation can be decomposed into two terms: both terms and describe a process where information is backward through weight layers or not. The term guarantees that information can be transferred back to shallower layers. Both the above equations also suggest that there is no sure that the gradient for can vanish for a mini-batch, and the general term cannot be equal to 0 for all samples in mini-batch since there can be some batches not equal to 0. That is why the gradient of the layers can vanish even if the weight can be extremely small. One additional feature that makes ResNet50 special is the 1x1 convolution we will discuss in the next section.
Network approach-based projection layer ( convolution)

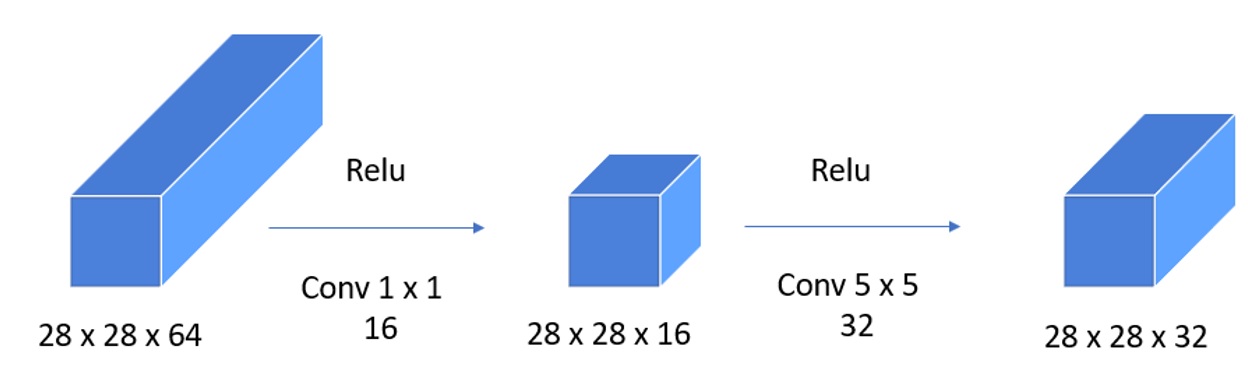
Example of a projection layer for dimensional reduction
The projection layer was first introduced in8 and is widely used for dimensional reduction in a convolutional neural network, avoiding the use of large space and time complexity. Suppose we have a layer that has 28×28×64 as Figure 3-3, width is 28 and equal to height and the number of filters is 64. If we want to shrink the height and width, we can use a pooling layer. However, if we want to do the same thing with the number of channels, as here what we want to do to reduce channels to 32 filters, we can use projection layers to decrease or keep the same channel or increase the number of channels. This can be very helpful in Inception Network. As usual, we use normal convolution with the same padding, and the kernel size is 5×5, with 32 filters having a size of 28×28 to receive output of shape 28×28×32. In this option, the computation cost is too high; we are easy to compute by a term that each filter has 5 ×5 ×64 , and we compute 28×28×32 so the final number of multiples is 5×5×64×28×28×32=40 million multiples. With the use of a 1 × 1 convolution, we can shrink the volume down to 28×28 ×32 by using 16 filters with a size of 1 × 1 to reduce the number of channels to 16 instead of 64. Then, on this much smaller volume, we can use a convolution with 32 filters whose kernel size is 5x5. Sometimes, it is called a bottleneck layer, and this can have a much smaller computational cost. We can easily calculate with the first layer 28×28×16 ×64 = 802,816 multiples, and in the second layer, the result is 28×28×32 ×5×5×16=10 millions. The sum number of multiples from two layers we can have approximately 11 millions, which is much smaller than the convolution without using 1 ×1 convolution. This can be called the bottleneck layer, as shown in Figure 3, Figure 4, and it is widely used in many types of models as an inception network or residual architecture. We can use this to significantly shrink the representation size, and it does not hurt the performance but saves many computations. This technique can be used for dimensionality reduction, decreasing the number of feature maps while retaining their salient features, or we can use them as a projection layer.
Example of a bottleneck layer
After having some prior knowledge about the architecture of ResNet50 and some basic SVM usage and its kernel difference, we developed an inextricable relationship to create classification models to categorize real estate images for commercial use. We attempt to apply ResNet50 for feature extraction purposes only. In the last layer of our model, we have dispensed with their pretrained softmax layer to alternate another layer using the SVM method. Our processing step is visualized below.

Our classification model using ResNet50 + SVM for classification purposes
Our methods proposed using SVM with a radial basis function kernel (RBF kernel). If we use a linear kernel or polynomial kernel, the result will worsen since the data distribution in the dataset is not linear or nonlinear. When we use RBF, the kernel will work exactly as a weighted nearest neighbor search. Data from closer distances will tend to have a higher impact on classifying the labels than further data.

Using SVM with different kernels on linear data
To deal with linear data (Figure 8), we can choose a linear kernel or polynomial kernel as an alternative option in the SVM kernel to drain the computation. If data tend to be nonlinear, the RBF kernel will be the best option to handle the variation between classes. We can see our visualization about how SVM classifies nonlinear data to have a clear view about our options in the baseline model (Figure 9).

Using SVM with different kernels on nonlinear data
EXPERIMENT
Dataset
Datasets in the artificial intelligence field, especially in deep learning, are one of the most striking factors that result in success in solving problems and tasks. Any algorithm needs a host of data as an input to apply it in models to optimize algorithms and apply it to commercial use. If we have big enough data, we can fine tune the model, which is pretrained to fit data upon our demands. Otherwise, we can use a pretrained network to extract features. We inherit a dataset from4, which has 7 classes: living room, dining room, bathroom, kitchen, bedroom, exterior and interior. The dataset is crowdsourced data of photos obtained from 9000 houses collected from Zillow for association with metadata from some real-estate websites for the regression task of estimating the market value of the houses. In real life, we need to consider that users can post more than these 7 classes, which is why our addition to the dataset is necessary. The users can post house ownership certifications to increase the trust to their customer or buyer, and some random users can post some unrelated images such as animal, pets, or car images. What we need to do is use the library to crawl and download images from Google images with specific search keys. The distribution from the crawled images should be the same as the dataset. This addition results in the new dataset called the REID dataset.
We introduce a dataset about real estate images categorized into 8 classes: living room, dining room, bathroom, kitchen, bedroom, exterior, documents and other. The other class contains some images that are not related to real estate images. With images from the real estate image class, we use the REI dataset.

Some example images from REI in the original dataset
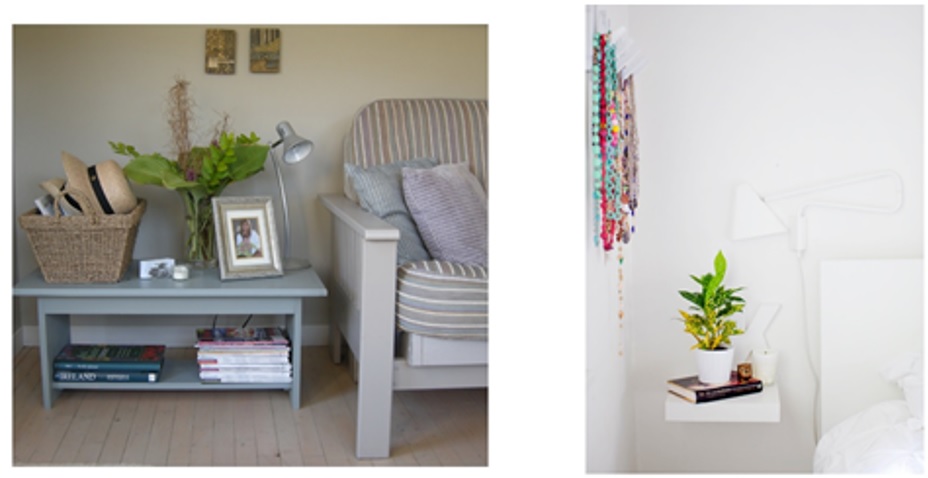
The above six classes of images are enough to build a model to classify images about real estate, but there are some special cases we need to consider. For example, users may post news and tend to post images about documents such as identity cards or house ownership certifications along with images about real estate to increase reliability. Alternatively, some random users or attackers tend to post irrelevant kinds of images, such as animal images, pets, cars or inappropriate images. Thus, we create two more classes called documents and another to handle this issue. A wider diversity helps our models categorize more objects or more scenes. The images below illustrate two classes we created:
After creating two new classes, we named our dataset the Real Estate Image Dataset (REID). From our dataset, we separate it into two main datasets, with the training dataset accounting for 87.7% (approximately 114,000 images) of the whole dataset and the test set comprising 2.3% and a development set comprising approximately 10% (13,000 images). Another dataset we contribute is a development set to check the performance of our models. This development set has the same distribution as the test set so that we can train and test on the test set.

Some crawled example images from Google to create the REID dataset
Experimental Results and Discussion
First, we create a convolutional neural network (including 7 layers). Batch normalization and dropout17 are used to reduce overfitting, and the Adam optimizer with categorical Kullback–Leibler loss is used to optimize the algorithm. However, when we adapted the confusion matrix, it showed us that the accuracy on the training set is approximately 95% and approximately 78% with the validation set. The main reason is that the size of the training set is too small (approximately 5000 images in total), and our model faces an overfitting problem at which we have small (below 0.01%) loss on the training set and have a high loss (approximately 70%) in the validation sets.
Up with the new idea that ResNet and DenseNet are quite good when used as a feature extractor. The accuracy was approximately 91% on the training set and 87% on the validation set. To summarize our result with the SVM, we use t-SNE 18 to visualize our high-dimensional data (2048) to 2 dimensional to check the distribution of our data, thus editing the attribute (adding, clear image, and excluding the noisy data). Our group tried out two types of classification problems with 4 classes and 8 classes. Our work was visualized in the image below with 4 classes (Figure 12) and 8 classes (Figure 13).

Visualization using TSNE for data distribution with 4 classes
Although the data were quite discrete in 4 classes when visualized using TSNE, when we applied to 8 classes, many types of rooms commonly existed inside the house and sometimes mixed. Figure 4-4 shows that the data distributions of the living room and dining room are very close to each other. The main reason why the distance of the two classes is so small is that the differences in the furniture of the two classes are very similar. The data distribution of 4 classes and 8 classes on the document and another are discrete from the remaining classes.

Visualization using TSNE for data distribution with 8 classes

Decision boundaries using SVM for 4 class classification
We then apply a confusion matrix to check the wrong prediction rate between classes. From the table below, we have concluded that our models categorize ‘Another’ classes well. Thus, we expect to exclude all the irrelevant images not related to real estate and posted by users. On the other hand, living room class and dining room class have a high wrong rate. There are many compelling reasons why these two classes have high rates; one of the most important reasons is that images from these two classes have chairs and tables and the same brightness.
Confusion matrix of 4 classes classification model in accuracy (%)
|
Another |
Document |
Exterior |
Interior | |
|
Another |
97.60 |
0.40 |
0.40 |
1.60 |
|
Document |
0.51 |
98.48 |
0 |
1.01 |
|
Exterior |
0.95 |
0.24 |
92.86 |
5.95 |
|
Interior |
0.26 |
0 |
0.92 |
98.82 |

Decision boundaries using SVM for 8 class classification
Confusion matrix of 8 classes classification model in accuracy (%)
|
Another |
Document |
Exterior |
Living room |
Kitchen |
Dining room |
Bathroom |
Bedroom | |
|
Another |
97.95 |
0 |
0 |
0.41 |
0 |
0 |
1.64 |
0 |
|
Document |
3.26 |
96.20 |
0.54 |
0 |
0 |
0 |
0 |
0 |
|
Exterior |
0.51 |
0 |
94.93 |
0.25 |
0.76 |
2.28 |
0 |
1.27 |
|
Living room |
0.76 |
0.25 |
1.78 |
66.67 |
2.04 |
13.49 |
2.29 |
12.72 |
|
Kitchen |
0 |
0.25 |
0.75 |
2.76 |
82.96 |
9.52 |
3.01 |
0.75 |
|
Dining room |
0 |
0 |
1.91 |
7.89 |
7.42 |
79.91 |
0.96 |
1.91 |
|
Bathroom |
0.52 |
0.52 |
0 |
1.80 |
1.29 |
0 |
94.07 |
1.80 |
|
Bedroom |
0.25 |
0 |
0 |
10.50 |
0.50 |
1.25 |
0.50 |
87.00 |
When we expanded classes from the interior classes, there was a huge difference among classes. From this table above, we can clearly see that our model categorizes very well on three types of classes: another, exterior and document. Classes fall into a high wrong rate: bedroom, living room, dining. Images from these classes sometimes have not had appropriate sights, such as lack of brightness, and do not contain enough features of that class. This case is illustrated in Figure 16.
Some mislabeled images from two classes: living room and bedroom
Images from Figure 16. just have a part of the living room, which causes confusion to the classification models. These types of images not only appear on the high wrong rate classes but also present on the low wrong rate classes. Take the bathroom class as an example (Figure 17): we can see in the two figures below that there are only two toilets in the first image and two lavabos in the second. Thus, these images need a better classification or exclude these images from the datasets for better performance, and we need to handle more about these situations.

Some mislabeled images from class bathrooms
In future studies, we will try out different ResNet architectures to determine the best models fit with the dataset. We also implement a preprocessing process for some special cases to focus on creating better data formats that handle realistic scenes in commercial usage for a data-centric approach.
CONCLUSION
From the experimental results, we come up with some general conclusions. A convolutional neural network is used, which is pretrained for feature extraction purposes only. This helps to reduce the time consumption when adding new classes or having more data on existing classes in a dataset that applies to real applications and servers. Transfer learning and SVM can classify datasets very well, but scalability is limited because when we apply a new class in a dataset, we must retrain SVM. With 4 classes, we gain 97,6% when using accuracy evaluation metrics on the test and gain 87,3% with 8 classes. On the other hand, we need to optimize to decrease the complexity of models by fine-tuning the pretrained model or using another convolution neural network in feature extraction. This process requires many times and factors: quantities of training data, features of images from the dataset (dimension, distribution of dataset).
We must make more efforts toward improving our method based on using SVM. In the deep learning field, especially in computer vision, data are a great contribution to solving problems of using neural networks properly. To achieve full potential of this, we must increase the amount of data to some certain classes, and we have to assure that our additional data must have the same distribution as the present dataset. On the other hand, we must ensure a balance between classes. Searching, finding more images to increase the diversity of the dataset in many aspects. Not only the dataset we have to take care of but also we develop on detecting objects in images so that we can estimate the price of the house based on the number of rooms and its luxury. We can adapt some object detection algorithms to analyze furniture inside the house to research the trend of decoration of different types of rooms. Furthermore, we expand our method for classifying some special rooms in real estate (not private homes), such as restaurants, hotels, stores, etc., or we can categorize scenes outside the house as bridges or skyscrapers to generalize our model for adapting to a wide range of demands in real life.
ACKNOWLEDGMENTS
This work was supported by Computer Vision Dept, Faculty of Information Technology, University of Science, Vietnam National University— Ho Chi Minh City, TopReal and Zetgoo through Intern Research Program 2020.