

Runoff Simulation for Pre-and-Post Hydropower Construction Periods in the Be River Catchment Using LST Model Calibrated by Differential Evolutionary Optimization
- Faculty of Environment, University of Science, Vietnam National University Ho Chi Minh City
- Faculty of Civil Engineering, Ho Chi Minh City University of Technology (HCMUT), Vietnam National University Ho Chi Minh City
Abstract
Introduction: Hydrological models play an important role in water studies. There have been numerous models developed and applied in river runoff simulation. This study focused on evaluating the runoff simulations using the LST model and the DE optimization for calibrating model parameters in the pre-hydropower construction (PrC) and post-hydropower construction (PoC) periods in the Be river catchment.
Methods: The model performance, parameter evolution, and objective function evolution in two periods were evaluated and compared. The duration between 1878 and 1993 was defined as PrC, in which 1978-1988 and 1989-1993 were used for calibration and validation, respectively. The PoC period was from 1994 to 2013, in which 1994-2006 and 2007-2013 were respective calibration and validation durations.
Results: The results showed that DE optimization was robust and efficient for calibrating model parameters. The LST model outperformed in natural daily runoff simulation with high NSI values of approximately 0.90 for PrC period. The lower performances were achieved in the PoC period with NSI greater than 0.7. On the other hand, good results were shown for the water balance index, PBIAS, with the obtained values of -0.266% and 6.906% for calibration and validation, respectively, of the PoC period. The obtained values for PrC period were -1.052% and 14.941%, respectively. Using DE optimization, an outperformed parameter set could be found in initial generations for natural runoff simulation of the PrC period.
Conclusion: The NSI evolution trend of the PoC period was similar to that of the PrC; however, it gave a lower performance in the initial and the last generations. Parameter evolutions are not the same for all parameters for both periods. Some have constant directions, and others change directions by generations.
Introduction
With the development of computer science and technology, the application of hydrological models in water resources fields has been increasing and requires high accuracy in simulations. The conceptual models have been commonly used among hydrological models because they give highly reliable results without time-consuming simulations1, 2. In addition to hydrometeorological data, the model performances highly depend on the model parameters. Therefore, parameter calibration plays an essential role in improving the accuracy of the models.
Model parameters are usually determined in manual selection and automatic selection using an optimization tool. Manual selection requires the modelers to have excellent modeling experiences and understand the model operations. This work is time-consuming and someway gives not high performance. Compared to manual selection, automatic calibration is an objective method that provides results with faster and easier implementation3, 4. In automatic calibration, parameters are automatically adjusted according to the specific schematic algorithm to search for optimal solutions. Automated optimization does not depend on the modeler’s correction but it depends on the optimization algorithm, objective function, model structure, and interactions between parameters 5. Some commonly used automatic optimizations such as SCE - UA (Shuffled complex Evolution), GA (genetic algorithm), PSO stream method (Swarm optimization herd), MOSCEM (multi-objective disturbance complex urbanization), ES (evolutionary strategy), DE (difference evolution) have been developed and applied for hydrological calibration. These methods do not give the same results when being applied in particular cases, so several studies have been conducted to evaluate the effectiveness of different algorithms. Raska and Ulrych evaluated Modified Downhill Simplex and DE for parameter optimization compared with Random Search, Downhill Simplex, Hill Climbing, Tabu Search, Local Search, Simulated Annealing, Evolution Strategy, and Differential Evolution optimization 6. Iwan et al. compared DE and SPO in constraint optimization, and the results showed that DE outperformed SPO7. Nezhad et al. developed an SCE algorithm using a DE for optimizing hydropower reservoir systems 8. Nandi & Reddy (2020) compared DE with GA and SCE algorithms for automatically calibrating the distributed variable infiltration capacity (VIC) hydrological model3.
DE algorithm, which was introduced by Storn and Price9, has been proved to be a powerful and efficient algorithm. It has been successfully applied in numerous fields of sciences such as computer science 10, biology11, environment 12, water resources8. Many researchers have investigated hydrological model calibration using SCE-UA, GA, PSO algorithms 4, 13. However, only a few studies using DE optimization in the hydrological model were found.
Be river is the biggest attribute of the Dong Nai river basin in southern Vietnam, which is rich in water resources and has a significant influence on the social-economic development of the area and the downstream. Runoff estimation in the catchment takes an essential role in water management and social-economic developing plan. In 1995, the first hydropower plan, Thac Mo, was constructed. Three other hydropower and irrigation dams were built, including Can Don, SrokPhuMieng, Phuoc Hoa. The dam operations significantly influence the downstream flows and the water supply in the catchment. However, there was no examination of difference in runoff estimating performance between the periods before and after human construction.
This work aims to introduce an application of the DE to automatic calibration for the Long-and Short-term runoff model (LST model)14. The model was applied to the Be river catchment. The model performances will be evaluated. At the same time, we will evaluate how much the runoff simulation estimation accuracy for the period after human construction changes compared to the period before the construction using the LST rainfall-runoff model with DE optimization for calibration.
Materials-Methods
Study area
Be river catchment was selected to investigate in this study. Be river originates from the southwest highland in Dak Nong province, with an elevation of 600-800 m. It is the largest tributary in terms of length, basin area, and contributed water volume of the Dong Nai River basin. The river's total length is about 350 km, and the catchment area is about 7600 km. The Be river has a narrow riverbed with a high river flow. The lowest flow in the dry season is around 60 m/s and the highest in the flood season is around 1000 m/s. The average flow of the catchment is about 250 – 300 m/s. The total annual flow is 7.9 – 9.0 billion m, approximately 25% of the water volume of the entire Dong Nai river system. In this study, the upper catchment at Phuoc Hoa station with an area of approximately 6000 km was considered for investigation. The study area has tropical monsoon climate conditions. There are two seasons during a year, namely the rainy and dry seasons. The rainy season lasts from May to October and accounts for 85% of annual rainfall, whereas the remaining 15% of the annual rainfall occurs in the dry season. The annual rainfall in the catchment varies between 1700 and 2700 mm. The catchment's average temperature, humidity, annual sunshine hours, and evaporation are about 25.5-26.7°C, 78.1%, 2500-3000 hours, and 1100 mm, respectively.
There are four hydropower dams, namely Thac Mo, Can Don, Srok Phu Mieng, and Phuoc Hoa, respectively, located upstream to downstream of the study area (Figure 1). Thac Mo hydropower plan was firstly constructed and completed in April 1995. The dam catchment has an area of 2200 km. The second dam is Can Don, which was started to operate in Jan 2004. The Can Don sub-catchment area is about 3225 km. The third hydropower dam, Srok Phu Mieng, was completed in December 2006 with an electricity-producing capacity of 2x51 MW. Hydropower production is not the major purpose of Phuoc Hoa dam. Major usage of the Phuoc Hoa dam is for irrigation, supplying water for agriculture of Ho Chi Minh City and Binh Duong, Dong Nai provinces. At the same time, the water from Phuoc Hoa lake is allocated to Dau Tieng reservoir, contributing to the supply of water to Tay Ninh, Ho Chi Minh, and Long An provinces.
Data
In this study, simulations of the years from 1978 to 2013 were investigated. We divided simulations into two periods, 1978-1993, when the hydropower dams were not constructed, and 1994-2013 when dams had been constructed and operated. For 1978-1993, the data durations of 1978-1987 and 1988-1993 were applied for calibration and validations, respectively. The durations of 1994-2006 and 2007-2013 were applied for calibration and validation in the latter period. Nine stations of rainfall, consisting of Binh Long, Bu Dop, Bu Dang, Bu Nho, Dong Phu, DakNong, Loc Ninh, Phuoc Long, Phuoc Hoa, were involved in the simulation. Two stations of meteorological data (temperature, humidity, sunshine hour, wind speed) at Phuoc Long and DakNong were used. Daily simulated discharges are compared with the observed at Phuoc Hoa station. Rainfall is the daily data, and other meteorological parameters are the monthly data.
LST model
LST model is a lumped conceptual hydrological model 14. As described in the Figure 1, the model structure contains three tank and the top tank consists of two layers. The balance equations of four tank layers are as follows:
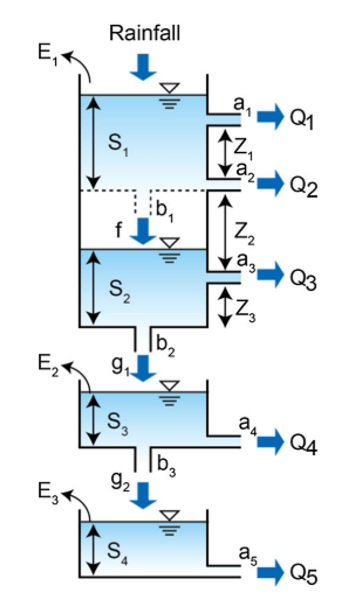
LST model structure
Where, is evaporation (mm); R is average basin rainfall (mm); f and g are respective surface and underground infiltrations (mm); is the surface flow (mm); and are subsurface flow (mm) and are underground flows (mm).
Runoff Qi and infiltrations are calculated as:
Where, a is the runoff coefficient, b is the infiltration coefficient, and Z is the side outlet height (mm).

Map of the study catchment
Model performance evaluation
Any rainfall-runoff model simulation must be evaluated by comparing the simulated runoff with the observed. There are numerous indicators have been used in model evaluation. In this study, the Nash - Sutcliffe efficiency index (NSI) was used for optimization's objective function. At the same time, two other commonly used indexes are applied to evaluate the model's performances. They are the rate of observed standard deviation (RSR) and percentage of error (PBIAS). These indicators are defined as below:
In these equations, n is the number of data, and are the simulated and measured discharge of the i day; are the average of simulated and measured discharges, respectively. The NSI equal to 1 indicate the optimal fitness between simulated and measured data. The optimal values for RSR and PIAS are zero. The higher values of NSI, the better of simulations they indicate. Contrary, the higher values of RSR and PBIAS indicate the lower performances. According to Moriasi et al.15, the simulation is evaluated as acceptable with NSI > 0.4, RSR < 0.5, and PBIAS < 40%.
DE optimization
Differential evolution (DE) is one of the widely-used global optimization algorithms proposed by Storn and Price (1997)9. DE operates similarly with other evolutionary algorithms (EAs) with mutation, crossover, and selection processes. However, it differs in terms of the crossover and mutation ways. The flowchart and detailed equations of the algorithm are shown in Figure 3. There are four steps, including initialization, mutation, crossover, and selection, described as follows.
Initialization: Initially, the Np individuals are generated using uniform probability distributed randomly as Eq.12 in the flowchart. Each individual i contains fifteen parameters of the LST model. The maximal and minimal boundaries, , are given to generate the initial population and they are also the boundaries for the offspring population. After that, the objective function of each individual is simulated to compare with the terminated condition. In this study, Nash - Sutcliffe efficiency index, NSI, was chosen as the objective function for optimization.
Mutation: If the terminated condition is not satisfied, the algorithm is continued with the mutation step to create the new population v as Eq.13 (Figure 3), with random indexes mutually different. F is a scale factor ∈ (0,1+).
Crossover: The crossover is processed to create new solutions u as Eq.14 (Figure 3). The crossover operator uses uniform random and the defined crossover rate to get the trial vector. The defined crossover rate is a fraction that controls the variable values that are copied from the mutation. In Eq. 14, rand is the jth evaluation of uniform random between [0,1], Cr is the crossover rate constant ∈ (0,1), j is the randomly chosen index ∈ (1, 15) in this study to ensure that gets at least one parameter from .
Selection: To decide which members are selected for next-generation G+1, the trial vector u is compared with the parent-based vector x, and the better one exists for the next generation. This step is called selection.
The mutation, crossover, and selection processes are repeatedly generated until the terminated condition is met. The terminated condition was set for 1000 generations in this study. The performance of DE will depend on the scale factor, F, and the crossover rate, Cr. In the study, the values of F=0.7 and Cr=0.2 were chosen following Hang and Chikamori (2017) 16.
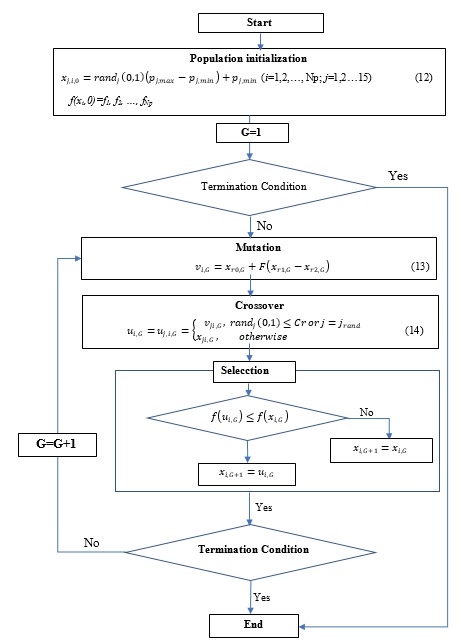
Flowchart of DE algorithm
Results
Calibration and validation
The daily flow at Phuoc Hoa station was calibrated and validated in two periods, before and after the hydropower constructions. In this catchment, the first hydropower plan, Thac Mo started to be structured in 1994 and operated since 1995; therefore, the selected periods in this study were 1978-1993 and 1994-2013. The 1978-1988 and 1994-2006 durations are for calibrations, and the 1989-1993 and 2007-2013 were used for validations. The model parameters for the PrC and PoC periods were determined by DE optimization. They are shown in
From Figure 4 and Figure 5, we can see that the simulated runoff well matched the observed for both calibration and validation duration of PrC period. The agreement between the observed and simulated in the PoC period was significantly lower than those of the PrC. However, the monthly flow shows a much better fitness between simulated and observed. It is easy to understand this phenomenon because the daily operation rates of hydropower dams were mostly different year by year.

Daily Observed and simulated flows (a) and colleration between the simulated and observed in calibration and validation (b and c) in the PrC period

Daily Observed and simulated flows (a) and colleration between the simulated and observed in calibration and validation (b and c) in the PoC period
The statistical indexes of NSI and RSR showed that the LST model with DE optimization resulted in the outperformed for the PrC period compared to the PoC. The NSI values of 0.916 and 0.895 were obtained for daily calibration and validation in the PrC. However, these fitness values were significantly lower for the PoC period. NSI values of 0.729 and 0.765 were achieved for calibration and validation, correspondingly. The rate of observed standard deviation, RSR, was 0.293 and 0.320 for calibration and validation in the PrC period. These figures for the PoC period were greatly higher, of 0.521 and 0.483. On the other hand, the higher performance of PBIAS is noted for the PoC period. The respective achieved values for calibration and validation were -0.373% and 7.113% in the PoC. In comparison, the higher value of 14.941% was reflected for the validation duration of PrC period (
Final best-calibrated parameter sets after 1000 generations in PrC and PoC periods
|
No. |
Parameters |
Unit |
PrC |
PoC |
Min – Max boundaries |
|
1 |
a1 |
- |
0.00050 |
0.00011 |
0.0001 - 0.0005 |
|
2 |
a2 |
- |
0.04379 |
0.04186 |
0.001 - 0.2 |
|
3 |
a3 |
- |
0.00696 |
0.01267 |
0.1-0.003 |
|
4 |
a4 |
- |
0.00299 |
0.00198 |
0.001 - 0.001 |
|
5 |
a5 |
- |
0.00032 |
0.00016 |
0.0001 - 0.0005 |
|
6 |
b1 |
- |
0.16592 |
0.14571 |
0.4-0.6 |
|
7 |
b2 |
- |
0.01273 |
0.02519 |
0.01 - 0.1 |
|
8 |
b3 |
- |
0.0090 |
0.00708 |
0.001 - 0.009 |
|
9 |
Z1 |
mm |
55.9154 |
73.3844 |
5 - 100 |
|
10 |
Z2 |
mm |
397.187 |
336.851 |
300 - 400 |
|
11 |
Z3 |
mm |
98.2855 |
93.4643 |
5 - 100 |
|
12 |
S1 |
mm |
10.38 |
13.7954 |
0 - 10 |
|
13 |
S2 |
mm |
134.407 |
130.632 |
0 - 200 |
|
14 |
S3 |
mm |
171.259 |
487.632 |
0 – 1000 |
|
15 |
S4 |
mm |
313.521 |
3584.41 |
0 - 4000 |
Statistical measurements of daily runoff performance in PrC and PoC periods
|
Statistical measurements |
PrC |
PoC | ||
|
Calibration 1978-1988 |
Validation 1989-1993 |
Calibration 1994-2006 |
Validation 2007-2013 | |
|
NSI |
0.914 |
0.895 |
0.729 |
0.765 |
|
RSR |
0.293 |
0.320 |
0.521 |
0.483 |
|
PBIAS |
-1.052% |
14.941% |
-0.373% |
7.113% |
Compared to the simulated daily runoff, the monthly data resulted in better statistical performances with the higher values of NSI and lower values of PBIAS and RSR. The achieved NSI of PrC was 0.961 and 0.928 for calibration and validation. These values for PoC were 0.805 and 0.871, respectively. A similar performance tendency was achieved for the RSR index, with better values obtained in the PrC period than those in the PoC. They were 0.198 and 0.265 for calibration and validation in the PrC; 0.441 and 0.358 were the respective values in the PoC. The water balance index, PBIAS, was -1.038% and 14.984% in the calibration and validation durations of PrC. The obtained values for the PoC were relatively better at -0.266% and 6.906%, respectively.
Statistical measurements of monthly runoff performance in PrC and PoC periods
|
Statistical measurements |
PrC |
PoC | ||
|
Calibration 1978-1988 |
Validation 1989-1993 |
Calibration 1994-2006 |
Validation 2007-2013 | |
|
NSI |
0.961 |
0.928 |
0.805 |
0.871 |
|
RSR |
0.198 |
0.265 |
0.441 |
0.358 |
|
PBIAS |
-1.038% |
14.984% |
-0.266% |
6.906% |
Objective function and parameter evolutions
Best optimized objective function evolution
Here, the NSI evolutions in calibration for PrC and PoC periods were analyzed and compared. The optimization evolution of the best NSI for two-period calibrations is shown in Figure 6. It was evident that NSI fitness values resulting from the LST-calibrated-DE model improved immensely after the first generations in both periods. However, they then changed slowly in the later generations. In the later generations, the lower speed of calibrated fitness was improved.
As mentioned above, the best NSI resulting from the PrC period was significantly greater than the PoC period. The best NSI of the initial generation was also remarkably different between the two periods. They were approximately 0.885 and 0.619 for the PrC and PoC periods, respectively. In the first generation, the calibrated NSI resulting from calibration in PrC period slightly increased to 0.889. There was no change of the best NSI in the first generation of PoC period. The best PrC-calibrated NSI changed gradually in the later generations. It reached 0.912 at the eightieth generation, not much different compared to the final value. The change of the best NSI in the first generations of the PoC period was significantly compared to that of the PrC. It was 0.690 at the thirteenth generation, increasing 0.081 compared to the initial one. This figure was only 0.014 for the PrC period. At 80 generation, the best NSI of the PoC period jumped to 0.720. After that, it changed slightly till the last generation.
It can be concluded that even using automatic optimization for calibrating simulated flow, the calibrated flow in the PoC period was still significantly varied from the observed compared to that in the PrC period. It took about thirteen generations to get the optimal solution with approximate performance of the one thousand generations in the PrC period. Even the parameters were still trained to get better parameter sets in the later generations; the improvement speed was relatively slow. The PoC period took more than thirteen generations to train the parameters to change significantly; however, change was unremarkable after eighty generations.
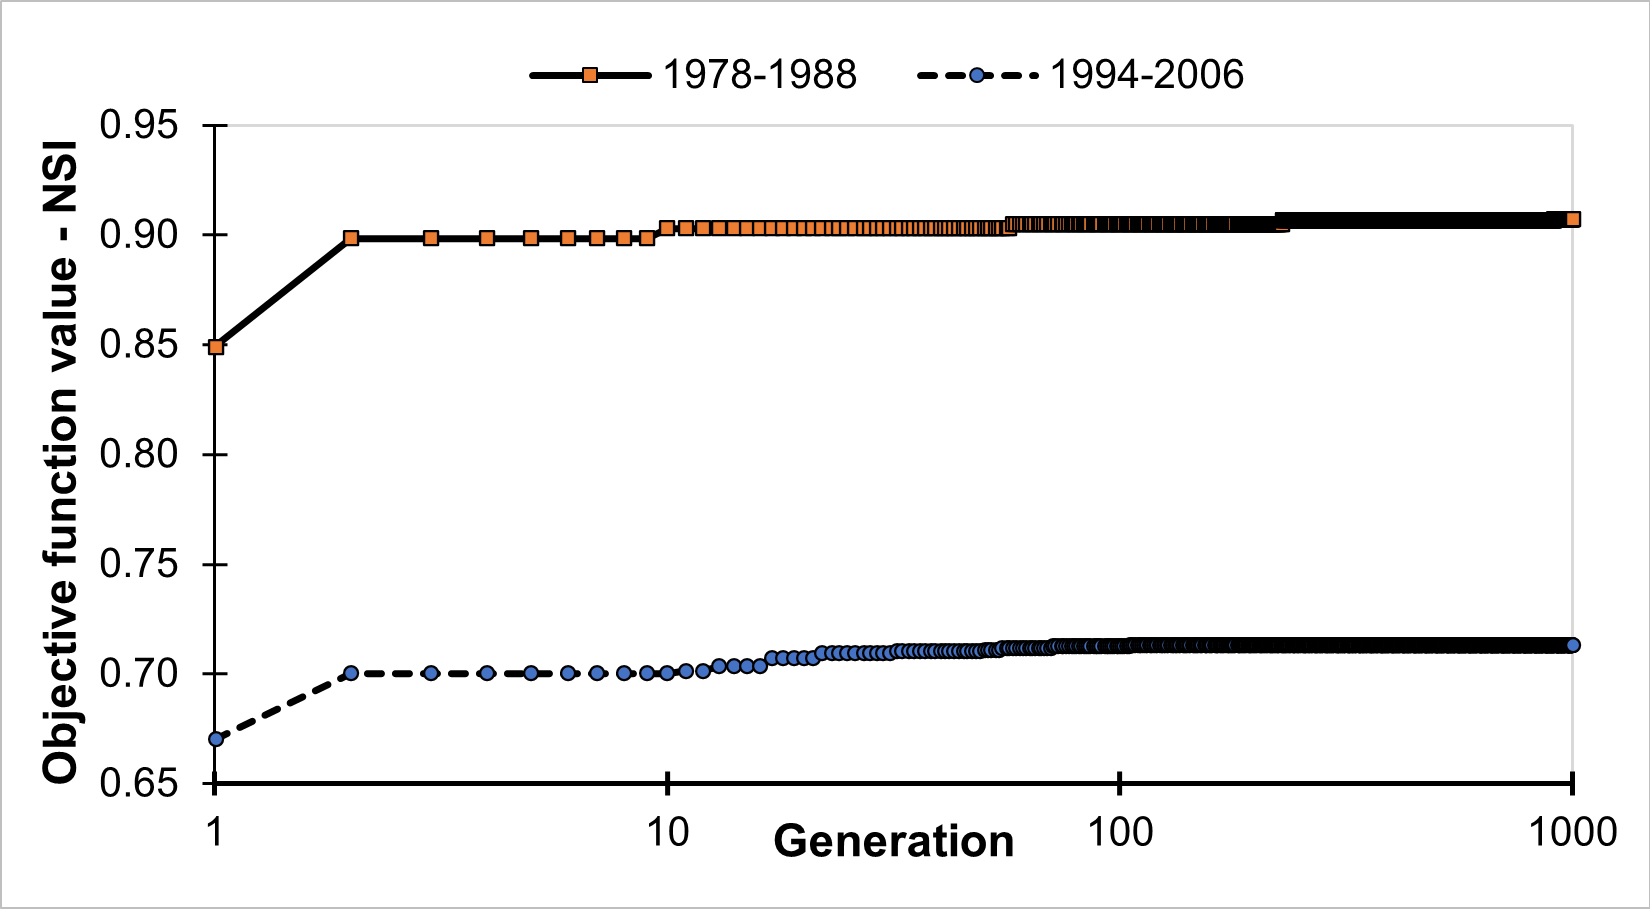
Objective function evolution during 1000 generations in two period calibrations
Parameter evolution
To fairly compare the performances among parameters, the achieved parameter values were standardized into the range [0, 1] based on the minimal and maximal boundaries of the parameters, as shown in
As mentioned above, the objective function values changed slightly after thirteen generations for PrC and PoC periods; however, some parameters in both periods still changed rapidly after these generation numbers. Another clear point can be seen from Figure 7 that the parameters in the model of PrC fluctuated significantly during one thousand generations of execution. The changes in parameters in the period after construction was just about ten times during 1000 generations. The objective function, however, was significantly compared to the parameters. These points indicate that numerous parameter sets were resulting in similar model performance. These phenomena can be explained by compensations among the parameters so that more than one solution can give a similar model performance.
From the results of parameter and objective function evolution progress, we can assume that the DE optimization has good performance in automatically calibrating the LST model. It resulted in the “very good” performance of NSI, approximately 0.90 in more than ten generations if there is no big human controlling construction in the catchment that influences the catchment flow. In the case of having huge human constructions, the achieved estimation was evaluated as “good” criteria; however, it was remarkably lower than those without human constructions.
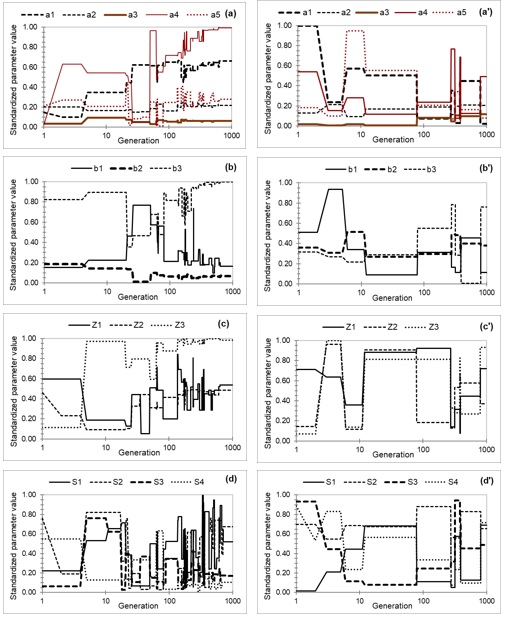
Evolution of model Parameters in calibration of PrC (left) and PoC (right) periods
Discussion
A question in this study sought to evaluate the DE optimization algorithm in the LST rainfall-runoff model applied to the Be river catchment. The results of the study indicated that DE optimization was effective and efficient in calibrating the LST model. This study confirms the power of the DE optimization technique in automatically calibrating a rainfall-runoff model 3. It resulted in the high performance of daily runoff simulation with few generations of the algorithm to be executed in both periods. In the PrC period, the NSI values were obtained approximately 0.915, within the “very good” range, according to Moriasi et al.15. Obtained RSR values were 0.320 or lower. PBIAS values were approximately -1% and 15% for calibration and validation. These values are within the “good” and “very good” criteria15. Dao Nguyen Khoi et al. simulated runoff simulation for Be river catchment using the SWAT model, and it was automatically calibrated using SWAT-CUP17. Their simulations resulted in the NSI and PBIAS values of 0.730 and 24% for the daily runoff; respectively, they are 0.860 and -24% for monthly runoff. The simulations in the duration of 1991-2010 gave the statistical performance of NSI=0.60, PBIAS= -5% for daily runoff, and NSI=0.710, PBIAS=-5% for the monthly runoff. The DE optimization integrated with the LST model resulted in the outperformed simulations. This result again demonstrated the power of DE optimization and the LST lump conceptual model in simulating catchment runoff.
Interestingly, it took more than ten generations for algorithm execution to achieve an NSI value of nearly 0.90, while the final obtained NSI was only nearly 0.915. The evolution was improved quickly in the initial generations, and the improvement was slower in the later generations. Results of parameters evolutions show that parameters did not have the same direction of evolutions. A parameter could go up in this generation, but it went down later. There were significant changes in parameters in the evolutions; however, the changes in NSI evolution were insignificant. This point indicates that numerous parameter sets were resulting in similar model performance. This phenomenon can be explained by compensations among the parameters so that more than one solution can give a similar model performance1. [Zhang et al. 2015]. The analysis agrees with the findings of other studies in terms of parameters and objective function evolutions3, 18.
The tendency of NSI evolution in the PoC period was similar to that in the PrC. The parameter evolutions were slightly different in the PoC period than the PoC in the late generations; however, the NSI improvement speed was slow in the latter generations in both periods. The performance of simulations in the PoC period was significantly lower than those in the PrC.
The DE model could train to find the parameter sets that resulted in the NSI value greater than 0.700, which was in the “good” range, according to Moriasi et al. 15. However, the significant difference of NSI values between two-period simulations indicates that the human dam constructions significantly impact the natural catchment flow. The dam outflows are not similar during a year. The optimization could not find the parameter sets that were constantly resulting in good agreement with the observations year by year. Even though the model performed as “good” range as evaluation criteria, considering human construction operations could result in a better simulation that matches the observed better.
The findings could contribute to studies on developing and using models for hydrological simulation. That helps us understand the DE algorithm effectiveness in the model calibration in general and specifically in the LST model. On the other hand, the study results emphasized the differences in calibrated model parameters and performances in runoff simulation for the case between natural flow and with being human controlling period. The results of simulations for PrC and PoC periods suggest that it should be carefully considered in runoff simulations with the catchment having massive human constructions. It may give a “good” performance; however, it is considerably lower than the case of natural flow simulations, especially for daily runoff. The monthly runoff prediction could be better for considering water resources investigation.
Conclusions
The paper has discussed the DE optimization applied in the LST model for simulating the catchment runoff in the periods before and after human constructions in the catchment. From the results, we can conclude that the LST model with DE optimization for the calibration resulted in outperformance of daily runoff and monthly simulation in the PrC period. For the PoC period, it can estimate the daily runoff by using DE optimization in calibrating model parameters. It resulted in relatively good performance NSI over 0.7. However, the parameters found in the calibration of PoC did not bring well-matched daily simulation with observation for the other durations. However, the parameters determined by DE optimization could be acceptable for estimating the monthly flow for the PoC period.
By using the DE optimization in calibration, we can find the “very good” parameter sets for the natural flow in only ten generations. Especially, the model can be improved significantly in the first generation. The evolution trends of NSI objective function were similar in PrC and PoC periods. However, the model seemed to be not much improved after 80 generations in the PrC and PoC periods; however, the improvement was insignificant in the later generation. The model parameters did not have similar evolution directions for all parameters. Some parameters tended to converge in 1000 generations; however, others did not have constant directions after generation and generation.
The study could be a good reference for the hydrological modelers investigating catchment runoff and model development. The current study only examined the NSI index as an objective function for optimization. Future work needs to consider other model evaluation indexes and the multi-objective function considerations in optimization.
LIST OF ABBREVIATIONS
DE: Differential Evolution
LST: Long-and-short-term
PrC: Pre-construction
PoC: Post-construction
NSI: Nash - Sutcliffe efficiency index
PBIAS: Percent bias
RSR: Rate of observed standard deviation
COMPETING INTERESTS
The authors declare that they have no competing interests.
Authors contributions
Nguyen Thi Thuy Hang and Dao Nguyen Khoi devised the conceptual ideas. Nguyen Thi Thuy Hang carried out the simulation. Tra Nguyen Quynh Nga and Nguyen Thi Thuy Hang performed the results and wrote the original draft manuscript. All the authors discussed and contributed to the final version of the manuscript.
Acknowledgments
This research is funded by Vietnam National University, Ho Chi Minh City (VNU-HCM) under grant number C2020-18-17. The authors would like to thank VNU-HCM for funding this work.