

Genetic diversity of the migratory Mekong endemic catfish species Pangasius macronema populating along the Hau and Tien Rivers
- Can Tho Unversity, Viet Nam
Abstract
Pangasius macronema is an endemic and important species with high economic value for fisheries in the Mekong River basin. The rapid increase in fishing levels can have an impact on genetic diversity. This study evaluated the genetic diversity of three wild populations of P. macronema using intersimple sequence repeat (ISSR) markers. Six primers were used to analyze 72 samples from three locations (populations) along the Hau and Tien Rivers in An Giang (n=20), Soc Trang (n=29), and Dong Thap (n=23). The results showed that all populations of P. macronema had relatively high genetic diversity (effective number of alleles, Ne, from 1.381 to 1.454 and unbiased heterozygosity, uHe, from 0.243 to 0.286), with the Soc Trang population having the highest level. As a result, Nei's unbiased genetic distances among the three populations were low, ranging from 0.015 to 0.035, with the smallest genetic distance between the An Giang and Dong Thap populations. The genetic differences among the three populations may be influenced by the species’ migration patterns and hydrological connectivity.
INTRODUCTION
Pangasius macronema (Bleeker 1851) is a small migratory catfish belonging to the Pangasiidae family. This species is endemic to the Mekong River basin and can be found across the region, including Thailand, Cambodia, Laos, and Vietnam1. The distribution of this fish generally occurs throughout the year, but it is more abundant during the migration period2. Poulsen et al. (2004) reported that P. macronema migrates from the mainstream of the Mekong River into smaller tributaries and rivers from April to June3. Migration can generate gene flow, inevitably affecting the genetic diversity of fish species4. On the other hand, seasonal migration provides resources for fisheries in the area.
P. macronema also plays an important role in local fisheries with high yield and economic value, although it is a small fish2, 5. In the Mekong Delta, the main catch season for this species is from March to May5. The catch production in Tien Giang Province – one branch of the Mekong River – is approximately 78.86 tons/year6. Nevertheless, the diversity of wild populations in the Mekong Delta can currently be threatened by serious effects such as overexploitation, water pollution, and food shortages7. Therefore, the size of wild fish populations tends to decrease rapidly, which can be associated with the decline in genetic diversity8.
In recent years, P. macronema has been cultured in the Mekong Delta using wild-caught fingerlings. They can be raised in earthen ponds and cages along the Tien and Hau Rivers9. The domestication process began because of an increase in seed demand for farming of this species. A good base broodstock population for domestication should be chosen based on genetic information.
Based on the aforementioned factors, it is necessary to investigate the genetic diversity of P. macronema. Previous genetic studies of this species, however, have been limited. Among various molecular markers used to determine the genetic diversity of fish species, ISSR (intersimple sequence repeat) is a simple but high-efficiency marker10. This study aimed to evaluate the genetic diversity of wild P. macronema populations along the Hau and Tien Rivers using ISSR markers. The results of this study provide preliminary genetic information for the management of wild populations and domestication program of this species.
MATERIALS AND METHODS
Fish sampling
P. macronema samples were collected from fishermen at three sites herein called three populations, including Thanh Binh district, Dong Thap province (DT), Chau Thanh district, An Giang province (AG), and Ke Sach district, Soc Trang province (ST). These sampling sites (Figure 1) are located at the two main river branches, Tien (DT) and Hau branch (AG and ST), of the Mekong River. The fish were identified based on morphological keys11, 12. This pangasiid species is characterized by a small body size (18-20 cm), large eyes, and long barbels reaching the pectoral-fin base. Samples from the three populations (n=23 for DT, n=20 for AG, and n=29 for ST) were chosen for genetic analysis. Fin clips of these samples were preserved in 95% ethanol until DNA analysis.
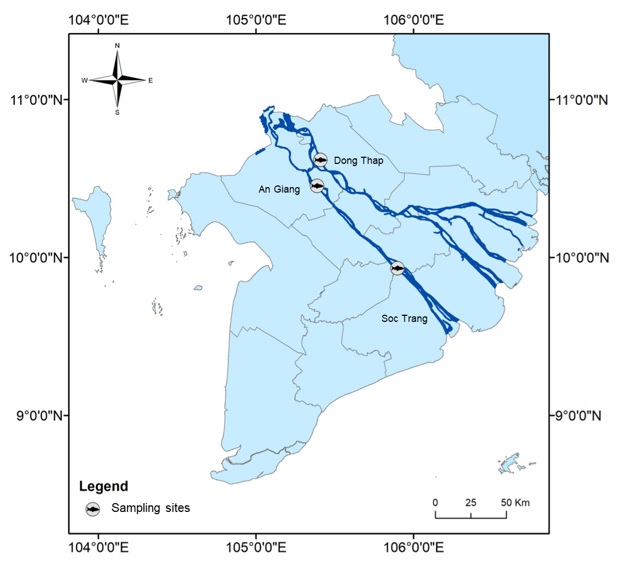
Sampling sites of three populations
Genetic diversity analysis methods
DNA extraction methods
DNA was extracted from fin clips by using the ammonium acetate protocol13. Approximately 25 mg of fin clip from each fish was first cut and then placed in an Eppendorf tube containing 650 µl of lysis buffer solution and 5 µl of Proteinase-K. After being incubated overnight at 55°C, all samples were added to 240 µl ammonium acetate and then incubated at 4°C for 30 minutes to precipitate the protein. Next, the tube was centrifuged at 10,000 rpm for 15 minutes two times, and 650 µl of the above solution was pipetted into a new tube. Then, 100% ethanol was added to the tube, incubated, and centrifuged to obtain DNA, which remained at the bottom of the tubes. Finally, the tube was air-dried, and 100 µl TE was added to obtain DNA.
Screening primers and PCR
Two samples from each population were selected randomly for primer screening. A total of 15 primers from ISSR libraries were screened. Six primers that had high polymorphisms and were visible on gels were chosen (
Sequences and annealing temperatures of the six primers used in the study
|
Primers |
Sequence (5’ – 3’) |
Ta |
References |
|
Micro11 |
[GGAC]4 |
44oC |
Fernandes Matioli et al. (2000) |
|
Chiu-SSR1 |
[GGAC]3A |
46oC |
Pazza et al. (2007) |
|
Chiu-SSR2 |
[GGAC]3C |
46oC |
Pazza et al. (2007) |
|
HB10 |
[GTG]5GC |
46oC |
Paterson et al. (2009) |
|
ISSR15 |
[TCC]5 |
46oC |
Tiwari et al., (2009) |
|
17898A |
[CA]6AC |
50oC |
Paterson et al. (2009) |
Electrophoresis and band scoring
PCR results after amplification were checked with 1.2% agarose electrophoresis. Each gel contained a 1 kb DNA ladder (ABM, Canada) and individuals representative of the three populations. The electrophoresis process was carried out at 50 V for 80 minutes. Then, the gels were dipped in ethidium bromide (5 μg/mL) solution for staining for 15 minutes. The bands were visualized by scanning in a UV transilluminator, and band sizes were estimated based on the DNA ladder.
ISSR bands of each gel were scored by using a binary data matrix, ‘1’ for the presence of the band and ‘0’ for the absence of the band. To minimize errors in band scoring, only clear and intensified bands were scored (low-intensity bands were not scored18, and scored bands were compared between gels of the same primers). Furthermore, scoring was performed independently by two lab technicians, and the results were then discussed to finalize the data.
Data analysis
Genetic diversity parameters, including the effective number of alleles (Ne), percentage of polymorphism, private alleles, unbiased expected heterozygosity (uHe), and Shannon index (I), were estimated for each population by using GenAlEx 6.5 software19. Genetic differences among the three populations were evaluated based on the overall genetic difference (G, Nei’s genetic distance, and principal coordinates analysis (PCoA). In addition, a dendrogram was constructed based on the unweighted pair-group method with arithmetic average (UPGMA) method using Popgene version 1.3.120 and MEGA 6.021.
RESULTS
ISSR variability
There were 72 samples from three populations using six primers (
Genetic diversity parameters of the three P. macronema populations
The genetic diversity parameters of P. macronema are presented in

ISSSR bands of
Genetic diversity parameters of three
|
Population |
Number of samples |
P (%) |
Ne |
I |
uHe |
|
Dong Thap |
23 |
86.57 |
1.423 ± 0.039 |
0.404 ± 0.028 |
0.268 ± 0.021 |
|
An Giang |
20 |
80.60 |
1.381 ± 0.040 |
0.369 ± 0.029 |
0.243 ± 0.021 |
|
Soc Trang |
29 |
94.03 |
1.454 ± 0.038 |
0.435 ± 0.024 |
0.286 ± 0.019 |
Genetic differences among the three Pangasius macronema populations
The overall genetic difference among populations (G) was 0.053, and the number of migrants per generation (Nm) was 8.90. The values of Nei's unbiased genetic distance and genetic identity among the three P. macronema populations ranged from 0.015 to 0.035 and from 0.966 to 0.985, respectively (
Nei’s unbiased genetic distance (below diagonal) and identity (above diagonal) among
|
Populations |
Dong Thap |
An Giang |
Soc Trang |
|
Dong Thap |
* |
0.985 |
0.983 |
|
An Giang |
0.015 |
* |
0.966 |
|
Soc Trang |
0.017 |
0.035 |
* |
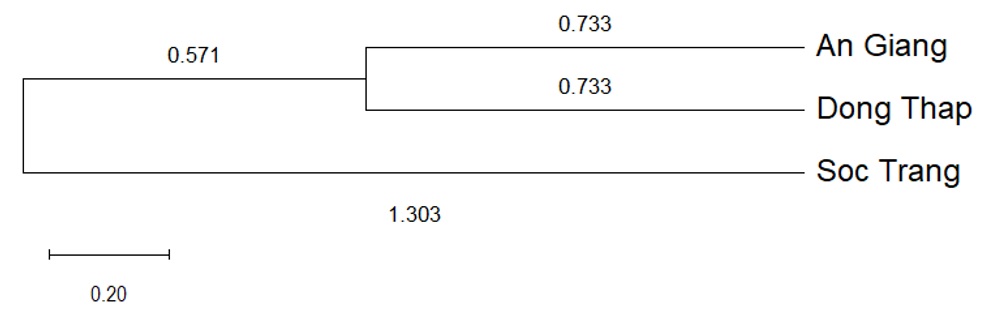
UPGMA dendrogram constructed using Nei’s unbiased genetic distances among three populations of
The molecular analysis of variance (AMOVA) showed that the genetic variation within populations (97%) was larger than that among populations (3%). Principal coordinates analysis (PCoA) indicated the genetic difference among the three populations in a two-axis (coordinate) plot, with 8.54% and 6.51% of the total genetic variation explained by coordinates 1 and 2, respectively (Figure 4). The AG and the majority of individuals from DT populations were clustered together in the same region, whereas most individuals from the ST population were distributed further apart from the plot. The ST population, followed by the DT population, was more widely scattered on the coordinate plot than the AG population, indicating that these two (ST and DT) populations had larger levels of genetic diversity.
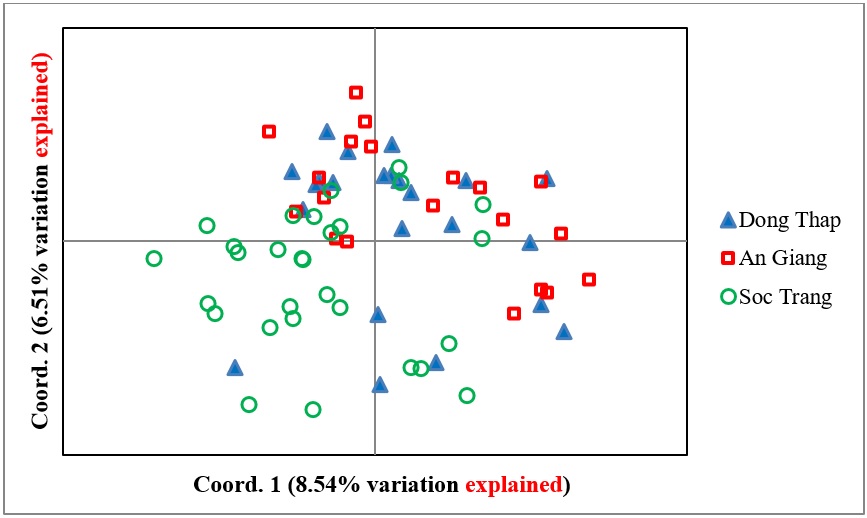
Principal coordinates analysis (PCoA) of
DISCUSSION
Levels of genetic diversity of P. macronema populations
The study found that all populations of P. macronema had high levels of genetic diversity (with Ne from 1.381 to 1.454, I from 0.369 to 0.435, and uHe from 0.243 to 0.286) in comparison with other fish species based on ISSR markers. A study on Pangasius krempfi showed lower values of genetic diversity parameters, with Ne from 1.352 to 1.376, I from 0.299 to 0.320, and uHe from 0.208 to 0.22222. In yellow catfish (Mystus nemurus)23, the results of Ne ranged from 1.225 to 1.284, lower compared to the present study. On the other hand, P. macronema has a higher and equivalent level of genetic diversity than some scale fish species. Kissing gourami (Helostoma temminckii) had less genetic diversity than P. macronema (Ne from 1.295 to 1.387, I from 0.269 to 0.386)24. In addition, genetic parameters based on eight ISSR primers of three Channa lucius populations in the Mekong Delta were comparable to P. macronema, with Ne ranging from 1.422 to 1.458, I from 0.364 to 0.395, and uHe from 0.250 to 0.271 25. Although the AG population of P. macronema had lower genetic parameters than the other two populations, the magnitudes of the differences were small, ranging from 3% to 5% for Ne and from 9% to 15% for I or uHe.
The genetic diversity of a population depends on internal factors of the population, such as population size and random genetic drift, and external factors of the gene exchange process due to the migration of individuals among populations4. The level of genetic diversity has a positive correlation with population size (or the number of individuals)26. Compared to other Pangasius species, P. macronema can be found in abundance, especially during the flooding season (from July to November) in tributaries of the Tien and Hau Rivers6, 27. Based on the catch data, 78.86 tons/year in Tien Giang Province, it can be predicted that P. macronema has a large population size in the Mekong Delta, resulting in the high level of genetic diversity of this fish. In small populations, random genetic variation is powerful, causing some genes to be completely lost 28. In kissing gourami (Helostoma temminckii), a low level of genetic diversity was observed in a closed population resulting from a small population size24. Moreover, the ability to exchange genes during migration is also a factor that can increase the genetic diversity of the population4. Hypostomus ancistroides in Brazil was detected to have low genetic diversity, which might be related to the sedentary habits of the species, reducing gene flow between populations of different locations29.
Genetic differentiation among P. macronema populations
The genetic differentiation of the P. macronema populations was low, as indicated by the low values of G (0.053) and Nei’s unbiased genetic distances and the high value of the number of migrants per generation (Nm=8.9). These parameters are indicative of genetic exchange among populations4. Nei’s unbiased genetic distances among P. macronema populations (from 0.015 to 0.035) were lower than those of other freshwater species in the Mekong Delta. The Nei’s values ranged from 0.023 to 0.102 for kissing gourami Helostoma temminckii24 and from 0.022 to 0.057 for Channa lucius (with G = 0.09)25. Baird et al. (2001) reviewed different hypotheses about the migration patterns of P. macronema1. The fish can migrate upstream from the Mekong River floodplain for spawning and from the main river to smaller streams and tributaries. Because of this migratory behavior, genetic flow occurs strongly. Consequently, gene flow reduces genetic differences between populations and increases the variation within populations4. An example is Malayan leaf fish (Pristolepis fasciata), which migrate during the flooding season from the Mekong River into wetland areas and then migrate back to the river in the dry season and have low genetic differences among populations30. In addition, another study found that the low genetic distance and weak genetic structure of P. krempfi were affected by their migration behavior22.
The genetic differences among the three populations of P. macronema may be affected not only by their migratory behavior but also by the geographical distance and the ecological conditions of the rivers. The geographical distance of the ST population and the other two populations was furthest, corresponding to larger genetic differences of ST-AG and ST-DT. Meanwhile, sampling sites in AG and DT are located in the Hau and Tien Rivers, but they are connected by the Vam Nao River. This hydrological connectivity allows gene flow between the AG and DT populations, resulting in their low genetic difference. Similarly, in wild Channa lucius populations in the Mekong Delta, a population with the greatest hydrological distance had the largest genetic distance from the other populations 25. On a geographically regional scale, Duong et al. (2019) reported that genetic differences among wild striped snakehead (Channa striata) populations in Vietnam and Cambodia were positively correlated with hydrological distances 31. Moreover, the distribution of river systems and ecological conditions can affect the migration of fish and ultimately the population structure32. The differences in river systems and associated ecological factors were determinants of the genetic differentiation of striped snakehead populations33 and climbing perch strains in Thailand34.
The findings of the present study have implications for the domestication and wild population management of P. macronema. In the Mekong Delta, domestication of P. macronema has been in progress with preliminary results of artificial reproduction (unpublished information). Because of their high genetic diversity, the three P. macronema populations, of which the ST population is relatively better, could be good resources for domestication. Furthermore, combining these groups would boost genetic variety in a base population, allowing for more effective domestication programs35. In terms of wild fish management, low genetic differentiation among the three populations (G=0.053) or large gene flow (Nm=8.9) implies that they can be considered a “panmictic population”, in which free genetic exchange occurs among individuals from different locations36. In this case, it is suggested that they can be managed as one population37.
CONCLUSIONS & RECOMMENDATIONS
The results from the ISSR markers showed that the three wild P. macronema populations had high levels of genetic diversity, of which the ST population had the highest level. The genetic differentiation among populations was low, as indicated by the low values of G and Nei’s unbiased genetic distances and the high gene flow value.
It is recommended that the three populations be managed as the entire population of the Lower Mekong River system. These populations can be utilized to generate a base population for domestication efforts (either individually or better in combination).
LIST OF ABBREVIATIONS
AMOVA: analysis of molecular variance
G: overall genetic difference among populations
I: Shannon index
ISSR: intersimple sequence repeat
Ne: number of effective alleles
Nm: number of migrants per generation
P: polymorphism
PCoA: principal coordinates analysis
PCR: polymerase chain reaction
uHe: unbiased expected heterozygosity
UPGMA: unweighted pair-group method with arithmetic average
CONFLICT OF INTEREST
The authors declare no conflicts of interest.
ACKNOWLEDGMENTS
This research was funded by the Vietnam National Foundation for Science and Technology Development (NAFOSTED) under grant number 106.05-2019.44.
AUTHORS’ CONTRIBUTIONS
Le Nguyen Mai Thy contributed to the investigation, data analysis and writing.
Duong Thuy Yen contributed to conceptualization, funding, writing and editing.