

Investigation of the parameters of a centrifugal pump working with a surfactant drag-reducing solution
- Thuyloi University, Viet Nam
Abstract
Flow resistance can be significantly reduced by adding a surfactant to the flow. As the flow resistance decreases, the pump performance also changes. In this study, the characteristic curve of the centrifugal pump was determined experimentally. The test was performed on solutions with different surfactant concentrations of 200 ppm and 400 ppm. The experimental results show that the total head of the pump for the case of a surfactant solution is greater than that when working with tap water. The efficiency of the pump for surfactant solutions also increases, but the shaft power for the case of surfactant solutions decreases compared to that for tap water.
INTRODUCTION
The flow resistance can be greatly decreased by adding small amounts of polymer or surfactant 1. Turbulent drag reduction can be used to increase the flow rate or reduce the pipe size and pump power consumption. Virk reported that using polymer drag reducers can reduce drag by up to 70% 2. However, the polymer solution is degraded under shear conditions when the liquid is transported through the impeller of the centrifugal pump 3. Mysel also observed a decrease in turbulent drag, reducing flow with surfactant additives 4. Mysels reported that surfactants can reduce drag by up to 80%. The advantage of surfactant drag reducers is their ability to self-assemble after being broken by high shear stress. Therefore, surfactants can be applied in closed circulation systems, such as district heating and cooling (DHC) systems of buildings and factories. In such systems, the liquid is circulated by centrifugal pumps in a closed cycle. Therefore, the use of surfactant-reducing additives can significantly reduce the power consumption of pumps in cooling and heating systems. The effect of surfactant solutions on pump performance has also been investigated by several researchers. Gasljevic and Matthys used two centrifugal pumps with different impeller diameters operating at 3450 rpm with a solution of positive ionic surfactant resistance (Ethoquad T13-50 of Akzo Chemical) with NaSal as a counterion 5. The results show that the head-flow rate relationship is not affected by either pump with different impellers, but the required pump power is reduced by up to 10%. However, these studies did not measure pump shaft power or study the effect of surfactant solutions on pump performance. Ogata and Watanabe6, 7 proposed a method of drag reduction measurement for pumps by measuring the torque acting on the impeller with surfactant solutions (Ethoquad O/12 by Lion) with NaSal as the counterion. The percentage of maximum drag reduction is approximately 30% when the Reynolds number is greater than 3×10. This suggests that the surfactant additive can improve the pump characteristics. However, in this study, the effect of surfactant concentration on pump performance was not mentioned. Ogata 6 performed another experiment to investigate the effect of surfactant concentration on pump performance. The results show that the pump efficiency increases with increasing surfactant concentration. However, the influence of the rotational speed of the pump impeller on the performance of the pump when pumping water with surfactant additives is not clear.
In this study, the phenomenon of reducing resistance in pipes with different concentrations (200 ppm and 400 ppm) was investigated. Moreover, the characteristics of the pump, such as the head, efficiency, and power consumption, were also investigated to evaluate the influence of surfactants on the ability to save energy.
MATERIALS AND METHODS
Materials
The cetyltrimethyl-amonium bromide (CTAB) surfactant solution (Glentham Life Sciences (England)) was mixed with a counterion (NaSal, Sigma‒Aldrich). The surfactants used for testing had concentrations of 200 ppm and 400 ppm. The combination of surfactant and counterion is described as follows: surfactant concentration × number of moles (., 200 ppm × 10; 400 ppm × 10). In this study, the molar ratio between the surfactant and the counterion NaSal was chosen to be 10. We chose this ratio because, according to some studies 5, 6, with this ratio, the solution has low viscoelasticity but still has a good ability to reduce drag. The mixture was dissolved in tap water and stored in a tank for 24 hours to obtain a physico-chemical balance.
Shear viscosity measurement
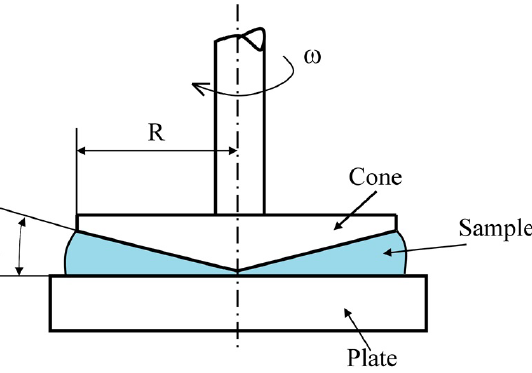
A rotational rheometer with cone-plate geometry (Discovery Hybrid HR-3, TA Instruments, USA, Figure 1) was used to measure the shear viscosity of the surfactant solutions. The sensor had a diameter of 40 mm and a cone angle of 1 degree. All measurements were performed in triplicate in steady shear mode within 0.01–1000 s at 20 ± 0.1°C. The rheometer was calibrated before measuring the viscosity of the test solutions by measuring the shear viscosity of deionized water.

The parameters of the cone-plate geometry.
Head and shaft power of the centrifugal pump

Schematic for measuring the drag reduction and centrifugal pump parameters (1. Centrifugal pump, 2. Electrical motor, 3. Couple, 4. Torque transducer, 5. Absolute pressure sensor, 6. Flow meter, 7. Differential pressure sensor, 8. Tank)
The parameters of the centrifugal pump (1) were experimentally measured while running with tap water and the CTAB surfactant. The experimental circuit is set up as shown in Figure 2. A tank (8) with a volume of 150 liters was used to store the surfactant solutions. Test pump (1) is a single-stage centrifugal pump with a flow rate, head, and speed of 13 L/min, 14.5 m, and 3600 rpm, respectively (Obara Pump, Japan). The head of the pump was measured by a pressure gauge (5) (M5200, Sensys Korea), the flow rate was measured with a flow meter (6) (FD-M 100, Keyence America), and the torque was measured by a torque transducer (4) (ATO-TQS-D01, ATO China). In this study, we investigated the phenomenon of drag reduction in a surfactant solution flowing through an acrylic pipe with an internal diameter of 17 mm. On the pipeline, a pressure transducer is designed to measure the differential pressure (7) (DP15-Valydine, USA). In addition, the speed of the pump is controlled by an inverter (Mitsubishi FR-E520-0.75K, Japan). A speed of 2350 rpm was also selected to investigate the effect of the impeller rotation speed on the centrifugal pump performance. The shaft power is estimated by a torque transducer.
RESULTS AND DISCUSSION
Shear viscosity

The shear viscosity as a function of the shear rate.
Figure 3 shows the relationships between the shear viscosity of the 200 ppm ×10 and 400 ppm ×10 surfactant solutions and the shear rate. For the 400 ppm × 10 surfactant solution, as the shear rate increases, the shear viscosity increases and reaches its maximum value at a shear rate of approximately 100 . A sudden increase in the viscosity of this solution occurs at sliding speeds ranging from 60 ¸ 100 . After reaching its maximum value, the viscosity decreases gradually. For a solution of 200 ppm × 10, the shear viscosity reached its maximum value when the shear rate was approximately 800 . The viscosity of the 200 ppm ×10 solution spikes sharply in the shear rate range (200 ¸ 800 ). Then, the viscosity decreases as the shear rate increases. At very high shear rates, the viscosity of the solutions is close to that of water.
For both the 200 ppm ×10 and 400 ppm ×10 solution concentrations, as the shear rate increases from the initial value to the critical value, the solution with the higher concentration has a higher viscosity. The critical value of the shear rate is smaller than that of the solution with a lower surfactant concentration. When the shear rate reaches the critical value, both surfactant concentrations above exhibit a sudden increase in viscosity (shear thickening behavior). Many studies have shown that shear thickening solutions can strongly reduce drag 7, 8, 9. This phenomenon can be attributed to the formation of gel-like structures under the effect of shear-induced structures (SIS). Due to the appearance of these SIS structures, which suppress eddies and stratify flows, the flow resistance is reduced, leading to an increased flow rate. After shear thickening occurs at the critical shear rate, the viscosity of the solution shows shear thinning behavior.
Surfactant drag reduction in pipe flow
Savins 10 was the first to use the phrase “Drag Reduction”. The drag reduction coefficient DR is the ratio of the pressure gradient of the drag-reducing solution (solvent with added drag-reducing additive) to the pressure gradient of the soluble solvent (solvent) at the same flow rate in the same pipe.
where and are the pressure gradients of the drag-reducing solution and the soluble solvent, respectively.
For turbulent flow in a circular cross-section pipe, drag reduction is usually expressed as a percentage (%) as follows:
where and are the coefficients of friction of the solvent and of the drag-reducing solution, respectively. The coefficient of friction is determined according to the following formula:
where is the diameter of the tube, is the density of the solution, is the velocity of the fluid in the tube, and is the length of the pipe that determines the pressure gradient.
Virk 11 proposed the maximum drag reduction asymptote (MDRA) by correlating the flow data for different polymer solutions. The MDRA concept has been used by drag reduction researchers and is called the Virk maximum drag reduction asymptote. Different soluble polymer solutions require different polymer concentrations to reach the asymptote. That equation is:
Or
For surfactant additives, the coefficient of friction may be lower than the Virk asymptote. Based on data for surfactant drag reducers in water and aluminum salts in hydrocarbon media, Zakin proposed a new asymptote for surfactant drag reducing additives 12:

Friction coefficients

The rate of drag reduction for different surfactant concentrations.
Solutions of surfactants in water can form worm-like micelles13. Compared with the reduced drag with Newtonian fluids in turbulent flow at the same flow rate, the presence of these micelles significantly reduces the flow resistance. Figure 4 depicts the friction coefficients as a function of the Reynolds number for water and different concentrations of surfactant solutions. The results showed that the friction coefficient is significantly influenced by the surfactant concentration. The effect of the micellar solution on the coefficient of friction can be described as follows: The first is the laminar flow (Re < 2300). As the surfactant concentration increases, the coefficient of friction of the surfactant solution increases. At this point, we can see that the coefficient of friction of the surfactant solution is greater than that of water. The second region is the extended region (2300 < Re < 10000). The friction curves are parallel to Zakin's maximum drag reduction asymptote12. In this region, the decrease in the coefficient of friction from the Blasius formula increases with the Reynolds number. At the end of the extended region, drag reduction still occurs in our test range (the maximum Reynolds number in our test is 60000).
The drag reduction rates of the 200 ppm × 10 and 400 ppm × 10 solutions were also calculated according to formula3 to clarify the effect of surfactant concentration on the coefficient of friction . In our experiment, the maximum value that can be achieved is approximately 52% (Figure 5). The increased binding of additive molecules during drag reduction, which occurs with increasing surfactant concentration, is thought to be the cause of the increase in the drag reduction rate. When the flow loss in the pipeline decreases, the flow rate also increases, and the pump power consumption decreases. In the following sections, the influence of surfactant concentration on the performance parameters and the working mode of the pump will be discussed.
Effect of surfactant additive on the head and shaft power of the pump
The surfactant solutions with different concentrations of 200 ppm and 400 ppm were circulated in the system at a pump impeller rotational speed of 2350 rpm. Experiments were carried out at 25 ± 2°C to investigate the effect of surfactant concentration on the head , power and efficiency parameters of the pump (Figure 4 and Figure 5).

Influence of surfactant concentration on the head of the pump.

Influence of surfactant concentration on the power of the pump.
Figure 6 shows that the total pump head for the case of surfactant solution is greater than that for tap water at the same flow rate, and as the surfactant concentration increases, the head also increases. For pumps, the shaft power is also an important parameter. The above experimental results show that the shaft power for the 200 ppm and 400 ppm solutions is significantly reduced at the same flow rate over the entire working flow range (Figure 7).

The influence of surfactant concentration on the head coefficient.
To evaluate the effect of surfactant concentration on the total head of the pump, we investigated the dimensionless coefficient of the head :
where and are the total head for tap water and the surfactant solution, respectively.
Figure 8 shows an increase in as the surfactant solution concentration increases. This provides sufficient evidence that the total head of the pump increases as the surfactant solution concentration increases at the same flow rate.
Change in the pump operating point
Based on the relationship between the pump head and the system head curve, it is possible to determine the operating point of the pump. Figure 9 shows the relationships between the pump head and system head for tap water and 400 ppm surfactant solution at 25±2°C. Due to the reduced pressure loss, the system head curve of the pump for the 400 ppm surfactant solution is greater than that for tap water. This increase in the head density was previously mentioned by Zakin14. The experimental results of this research group indicate that the pressure loss is reduced when . In addition, the ability to reduce drag increased as the concentration of the surfactant solution increased.

Influence of surfactant concentration on the operating point of the pump.
It is clearly observed that the total pump head increases for the 400 ppm surfactant solution, as shown in Figure 9. The operating point (A) for the case of tap water changes to the new operating point (A') for the case of surfactants. The pressure loss reduction ratio △H and flow rate increase rate △Q were 6.9% and 9.3%, respectively.
Conclusion
The performance characteristics of centrifugal pumps are measured experimentally when running with tap water and surfactant solutions. By analyzing the effects of surfactant solution on pump performance, pump running state change, and concentration, we can draw the following conclusions. The total pump head increases as the surfactant solution concentration increases, but the shaft power decreases. In addition, the head efficiency of the pump when operating with the surfactant solution is also higher than that when operating with tap water, and the head efficiency increases with increasing rotation speed of the impeller. Thus, by using surfactants, we can reduce the power needed to drive the pump, reducing the initial investment cost of the system.
Abbreviations
None.
Acknowledgments
None.
Funding
None.
CONFLICT OF INTEREST
The author declares that he has no conflicts of interest in publishing this paper.