

Effects of source correction on positron annihilation lifetime spectroscopic analysis of graft-type polymer electrolyte membranes
- Faculty of Materials Science and Technology, University of Science, Ho Chi Minh City, 227 Nguyen Van Cu, District 5, Ho Chi Minh City, Viet Nam
- Vietnam National University, Ho Chi Minh City, Viet Nam
- Faculty of Physics and Engineering Physics, University of Science, Ho Chi Minh City, 227 Nguyen Van Cu, District 5, Ho Chi Minh City, Vietnam
- Biotechnology Center of Ho Chi Minh City, Ho Chi Minh City, Vietnam
- Research and Development Center for Radiation Technology (VINAGAMMA), Ho Chi Minh City, Vietnam
- Applied Physical Chemistry Laboratory, University of Science, Ho Chi Minh City, 227 Nguyen Van Cu, District 5, Ho Chi Minh City, Vietnam
Abstract
Introduction: Recently, the free-volume hole features of poly(styrene sulfonic acid) (PSSA)-grafted poly(ethylene-co-tetrafluoroethylene) polymer electrolyte membranes (ETFE-PEMs) have been studied using positron annihilation lifetime spectroscopy (PALS) to determine the relationship between gas crossover through a PEM and a fuel cell. As one such series, this work investigates the source correction in PAL spectroscopic analysis for ETFE-PEM. Method: ETFE-PEM was prepared by radiation-induced graft polymerization and subsequent sulfonation. The free-volume hole characteristics of ETFE-PEM with a grafting degree (GD) of 106% were determined using PALS with and without source correction. Results: After source correction, the original-ETFE and ETFE-PEM strains exhibited increases in r3 (smaller radius of free-volume holes in the lamellar amorphous regions, the PSSA grafts, and the interface zones inside the lamellae) and r4 (larger radius of free-volume holes in the mobile amorphous layers and the PSSA grafts outside of the lamellae). In addition, the full width at half maximum (FWHM) of r3 is much greater than that of r4 due to the rearrangement in the mobile amorphous region and the polystyrene layers outside the lamellar structure. Conclusion: Source correction causes a significant change in the distribution curves of r3 for the original-ETFE and ETFE-PEM. Thus, source correction of positron annihilation lifetime spectroscopic analyses is an important issue for determining the o-Ps lifetime of polymers, which is near the lifetime of positrons in source materials.
INTRODUCTION
Proton exchange membrane fuel cells (PEMFCs) have received much attention for novel power generation because these devices result in no emission of environmental pollutants, high energy generation efficiency, low operating temperature, and quick operation1. PEMFCs can be applied in transportation, mobile communication equipment, charging stations, etc. 2. Nafion is one of the most common commercial membranes used for PEMs3, 4, 5. However, its limitations, such as high cost and low performance at high temperature (> 100 °C) and low relative humidity (RH) (RH < 50%), have triggered the development of alternative membrane materials for PEMs. Recently, poly(styrene sulfonic acid)-grafted poly(ethylene-co-tetrafluoroethylene) (EP) electrolyte membranes (ETFE-PEMs) have been studied intensively to replace Nafion because of their competitive price, performance, and durability. Compared with Nafion, the ETFE-PEM shows greater mechanical strength, conductance, and microstructural stability under immersed conditions6, 7, 8, 9.
Positron annihilation lifetime spectroscopy (PALS) is a potential method that provides molecular and nanoscale information on the free-volume hole features of materials through the lifetime and annihilation intensity of positron and positronium (Ps) ions. Positronium is the metastable hydrogen-like bound state of a positron and an electron. Ps freely has two intrinsic lifetimes, namely, para-positronium (-Ps, singlet state of Ps) and ortho-positronium (-Ps, triplet state of Ps). In the singlet state, -Ps emit two energetic photons at 511 keV with a typical lifetime of 0.125 ns in vacuum. In the triplet state, -Ps has a self-annihilation lifetime of 142 ns in vacuum and emits three continuous energies from 0 to 511 keV. In essence, the lifetime of -Ps (142 ns) is usually shortened to a few nanoseconds (1–10 ns) by picking up a molecular electron with an opposite spin to that of the positron (the "pick-off" mechanism)10, 11. Recently, free-volume hole features of ETFE-PEM have been probed by PALS12, 13, 14. The PALS of ETFE-PEM was analyzed using 4 lifetime components. The shortest lifetime, τ ~ 0.125 ns, corresponds to the lifetime of the -Ps, the moderate lifetime, τ ~ 0.3–0.5 ns, is the lifetime of the free positron, and the longer lifetimes, τ and τ are attributed to the lifetime of the -Ps. The obtained results predicted that gas molecules pass more dominantly through the mobile amorphous zones and the PSSA grafts outside of the lamellae than through the inside. Moreover, the free-volume hole size of the ETFE-PEM is lower than that of Nafion, leading to less gas passing through the membrane. However, the above studies did not address in detail the effect of source correction in positron annihilation lifetime spectroscopic analysis, although this issue is quite important, as reported previously15, 16, 17, 18. Therefore, this work studies the effect of source correction on the PAL spectroscopic analysis of ETFE-PEM.
EXPERLMENTAL
Materials and preparation
Figure 1 shows that the preparation process of ETFE-PEM consists of two main steps: graft polymerization and sulfonation. Commercial ETFE films were obtained from Asahi Glass Co. Ltd., Tokyo, Japan, and had the same thickness of 50 μm. The ETFE films were irradiated by gamma rays from a Co source with an absorbed dose of 15 kGy under an argon atmosphere. The irradiated samples were immersed immediately in a styrene solution of toluene at 60 °C for 24 h for graft polymerization. These obtained films were subsequently immersed in a toluene solution at 50 °C for 24 h to eliminate the homopolymers and the residual monomers. Then, a polystyrene-grafted ETFE film (grafted-ETFE) was obtained. The grafting degree (GD) was determined by the formula GD (%) = 100(Wg – Wo)/Wo, where Wo and Wg are the weights of the film before and after graft polymerization, respectively. The grafted-ETFE was then sulfonated with chlorosulfonic acid in 1,2-dichloroethane at 50 °C for 6 hours. The membrane was washed again with pure water at 50 °C for 24 h to obtain ETFE-PEM 19, 20. In this study, grafted-ETFEs and ETFE-PEMs with a GD of 106% were utilized for positron annihilation lifetime spectroscopic analysis. This GD was selected because the graft layers are high enough to clearly investigate the effects of source correction.

Synthetic scheme and molecular structures of ETFE-PEM obtained via radiation-induced graft polymerization of styrene onto an ETFE substrate to obtain the grafted-ETFE film and subsequent sulfonation.
PALS measurement
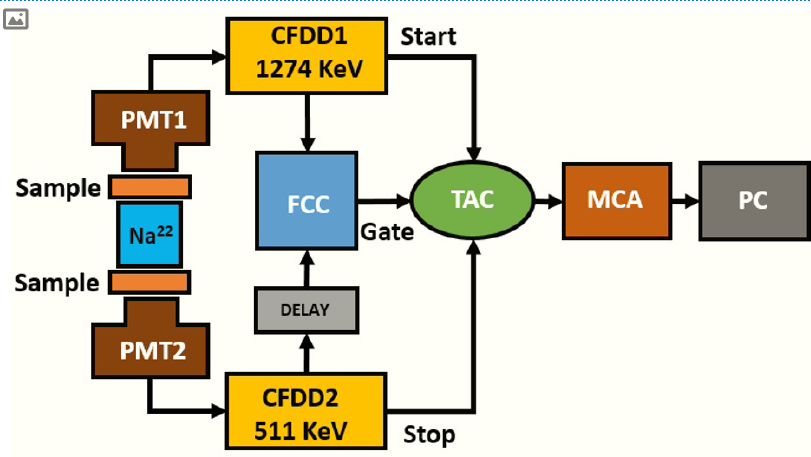
PALS measurements were performed using a NaCl (20 μCi) positron source at room temperature under vacuum. Several pieces of identical samples were cut into 1x1.5 cm pieces and stacked with a total thickness of 1 mm to ensure that all annihilation events occurred within the samples. Before conducting the PALS measurements, the ETFE-PEM was dried in a vacuum oven at 40 °C for 24 h to remove water molecules. Figure 2 shows the function and operation of a photon‒photon delay random coincidence spectrometer for lifetime detection 21, 22. When a positron (E = 0.54 MeV) is emitted from a NaCl source, a high-energy gamma-ray of 1.274 MeV is produced simultaneously and marked as the start signal of the positron. The positron penetrates, heats, and diffuses in the sample and then annihilates with an electron to provide annihilation photons (stop signal). The time difference between the start and stop signals is specified as the positron or positronium lifetime. In this study, source correction was carried out at 372 ps with a 10% annihilation intensity23. The PAL spectrum was combined into (1–3)x10 counts or more to ensure statistical support for subsequent analyses. The analysis was performed by using LT v9 software24.

Experimental diagram for the PALS measurements. The setup included a photomultiplier tube (PMT), a constant–fraction differential discriminator (CFDD), a fast coincidence unit (FCC), a time–to–amplitude converter (TAC), a multichannel analyzer (MCA), and a computer (PC).
PALS analysis
In this study, the subnanometer holes in all the samples are assumed to be spherical. This assumption is used for many PAL spectroscopic analyses of polymers13. The relationship between the hole radius and the lifetime of ortho-positronium trapped in the holes is shown by the Tao–Eldrup (TE) model, which is represented by the following formula 25, 10:
where τ (ns) (i = 3, 4) is the lifetime component, r is the pore radius (nm), and ∆R (≈ 0.166 nm) is the thickness of the electron layer.
The nanohole volume, , is determined by the equation :
In addition, the radius distribution provides important information about the distribution features calculated based on the following equation24, 26:
where is the probability density function of the o-Ps annihilation rate ) defined through the following formula:
where is the maximum position of and is the standard deviation quantity of the i-th distribution.
The pore volume distribution is also estimated using the following equation:
RESULTS
Figure 3 shows typical decay curves of positron annihilation in the original ETFE, grafted-ETFE, and ETFE-PEM with a GD of 106%. The PALS of the original ETFE plot shows at least two slopes with a decrease at approximately 2 ns. The decay curves of grafted-ETFE and ETFE-PEM differ from each other and from that of pristine ETFE. Based on the decay curve features, the spectra of all the samples were analyzed using a four-component model, as shown in

PAL spectra of the pristine ETFE, grafted-ETFE, and ETFE-PEM samples with a GD of 106%.
Results of the PAL spectroscopic analyses with and without source correction for the original ETFE, grafted-ETFE, and ETFE-PEM with a GD of 106%
|
Samples |
τ1 (ns) |
τ2 (ns) |
τ3 (ns) |
τ4 (ns) |
I1 (%) |
I2 (%) |
I3 (%) |
I4 (%) |
|
Without source correction | ||||||||
|
Original ETFE |
0.170 ± 0.009 |
0.441 ± 0.007 |
1.620 ± 0.190 |
3.556 ± 0.082 |
37.4 ± 1.9 |
51.7 ± 1.9 |
3.8 ± 0.4 |
7.1 ± 0.6 |
|
Grafted-ETFE 106% |
0.175 ± 0.006 |
0.435 ± 0.022 |
1.720 ± 0.150 |
2.893 ± 0.079 |
43.6 ± 1.9 |
26.6 ± 1.5 |
12.6 ± 1.7 |
17.2 ± 2.0 |
|
ETFE-PEM 106% |
0.168 ± 0.007 |
0.432 ± 0.008 |
1.074 ± 0.097 |
2.436 ± 0.048 |
33.2 ± 1.1 |
57.0 ± 1.0 |
4.5 ± 0.6 |
5.5 ± 0.3 |
|
With source correction | ||||||||
|
Original ETFE |
0.174 ± 0.006 |
0.463 ± 0.008 |
1.790 ± 0.230 |
3.610 ± 0.110 |
39.4 ± 0.9 |
48.4 ± 0.9 |
4.4 ± 0.6 |
7.8 ± 0.8 |
|
Grafted-ETFE 106% |
0.168 ± 0.005 |
0.460 ± 0.025 |
1.720 ± 0.150 |
2.894 ± 0.079 |
45.5 ± 1.8 |
21.4 ± 1.1 |
13.9 ± 1.8 |
19.2 ± 2.1 |
|
ETFE-PEM 106% |
0.176 ± 0.004 |
0.454 ± 0.006 |
1.270 ± 0.150 |
2.444 ± 0.039 |
36.4 ± 0.6 |
53.8 ± 0.5 |
4.0 ± 0.2 |
5.8 ± 0.4 |
Figure 4 shows the distribution curves of hole radii a) r and b) r for the original ETFE, grafted-ETFE, and ETFE-PEM with source correction (solid line) and without source correction (break line). As shown in Figure 4a, the hole radius r of the original ETFE is quite symmetrical, and the radius distribution peak is shifted to a higher position by source correction. Moreover, the distribution curve of the grafted-ETFEs shows symmetry and no change in peak position. For the ETFE-PEM, the curve features are similar to those of the original ETFE, the two peaks are more separated, and the peak is shifted to a higher position after source correction. In Figure 4b, the hole radius distribution r for the original ETFE is similar to that of r. In the grafted-ETFE and ETFE-PEM samples, two peaks show symmetry and no change in peak position.

Hole radius distributions (r3 and r4) of the original ETFE, grafted-ETFE, and ETFE-PEM with a GD of 106% with and without source correction.
Figure 5 shows the free hole volume distribution curves of a) V and b) V for the original ETFE, grafted-ETFE, and ETFE-PEM without (solid line) and with source correction (break line). As shown in Figure 5a, the distribution curves of both the original ETFE and ETFE-PEM products show partially separated peaks, no symmetry with the presence of tails, and peak positions that shift to higher values after source correction. In contrast, the distribution curve of grafted-ETFEs is quite symmetrical with a small tail and shows little change in peak position. Figure 5b shows more symmetry in the distribution curves of V for all the samples, but the peak position shifted to a higher value after source correction was applied for the pristine ETFE sample.

Hole volume distributions (V3 and V4) in the original ETFE, grafted-ETFE, and ETFE-PEM with a GD of 106% with and without source correction.
DISCUSSION
The lifetime and annihilation intensity parameters before and after source correction are shown in
Values of r3, r4, FWHM(r3), and FWHM(r4) estimated from the hole radius distributions
|
Samples |
r3 (nm) Distribution |
r3 (nm) TE |
r4 (nm) Distribution |
r4 (nm) TE |
FWHM(r3) (nm) Distribution |
FWHM(r4) (nm) Distribution |
|
Without source correction | ||||||
|
Original ETFE |
0.246 |
0.248 |
0.399 |
0.399 |
0.048 |
0.012 |
|
Grafted-ETFE 106% |
0.257 |
0.258 |
0.356 |
0.356 |
0.036 |
0.013 |
|
ETFE-PEM 106% |
0.177 |
0.178 |
0.322 |
0.323 |
0.035 |
0.009 |
|
With source correction | ||||||
|
Original ETFE |
0.266 |
0.265 |
0.401 |
0.402 |
0.054 |
0.015 |
|
Grafted-ETFE 106% |
0.257 |
0.258 |
0.356 |
0.356 |
0.036 |
0.013 |
|
ETFE-PEM 106% |
0.204 |
0.206 |
0.323 |
0.323 |
0.047 |
0.007 |
Values of V3, V4, FWHM (V3), and FWHM (V4) estimated from the hole volume distributions
|
Samples |
V3 (nm3) Distribution |
V3 (nm3) TE |
V4 (nm3) Distribution |
V4 (nm3) TE |
FWHM(V3) (nm3) Distribution |
Distribution FWHM(V4) (nm3) |
|
Without source correction | ||||||
|
Original ETFE |
0.060 |
0.064 |
0.266 |
0.266 |
0.034 |
0.023 |
|
Grafted-ETFE 106% |
0.070 |
0.072 |
0.189 |
0.190 |
0.030 |
0.021 |
|
ETFE-PEM 106% |
0.022 |
0.024 |
0.140 |
0.141 |
0.014 |
0.012 |
|
With source correction | ||||||
|
Original ETFE |
0.078 |
0.078 |
0.271 |
0.271 |
0.046 |
0.031 |
|
Grafted-ETFE 106% |
0.070 |
0.072 |
0.189 |
0.190 |
0.030 |
0.021 |
|
ETFE-PEM 106% |
0.034 |
0.037 |
0.141 |
0.141 |
0.024 |
0.009 |
CONCLUSION
Positron annihilation lifetime spectroscopic analyses were performed to observe the effect of source correction for the original ETFE, grafted-ETFE, and ETFE-PEM with a GD of 106%. r, r, FWHM (r), and FWHM (r) of the original ETFE and ETFE-PEM but not the grafted ETFE increase after source correction. Similar results are also obtained for V, V, the FWHM (V), and the FWHM (V). Interestingly, the FWHM (for r and V) was much lower than the FWHM (for r and V). This result indicates that the amorphous lamellar region is less mobile than the amorphous phases and polystyrene layers located outside of the lamellar structure; additionally, the amorphous lamellar region can be rearranged, leading to smaller FWHM values (r and V). Note that source correction significantly influences the distribution curves of r and V of the original-ETFE and ETFE-PEM. This result suggested that source correction during positron annihilation lifetime spectroscopic analyses is an important issue for determining the -Ps lifetime of polymers, which is near the lifetime of the positron in the source materials.
LIST OF ABBREVIATIONS
ETFE: Poly(ethylene-co-tetrafluoroethylene)
ETFE-PEM: Polystyrene Sulfonic Acid (PSSA)-Grafted Poly(ethylene-co-Tetrafluoroethylene) Polymer Electrolyte Membranes
FWHM: Full width at half maximum
GD: Grafting degree
grafted-ETFE: Polystyrene (PS)-Grafted Poly(ethylene-co-Tetrefluoroethylene) Polymer Electrolyte Membranes
-Ps: Ortho-Positronium
PALS: Positron Annihilation LifeTime Spectroscope
PEM: Polymer electrolyte membrane
: Para-Positronium
Ps: Positronium
PSSA: Polystyrene Sulfonic Acid
RH: Relative humidity
TE: Tao-Eldrup
AUTHOR CONTRIBUTION
Tran Duy Tap: Conceptualization, Project Administration, Fundingacquisition, Supervision, Resources, Investigation, Methodology, Data curation, Formalanlysis, Supervision, Validation, Visualization, Writing – original draft, Writing – review & editing. Nguyen Huynh My Tue: Investigation, Methodology, Data curation, Formalanysis, Supervision, Validation, Visualization, Writing – original draft, Writing – review & editing. Tran Hoang Long, Dinh Tran Trong Hieu, Lam Hoang Hao, Vo Thi Kim Yen, Nguyen Manh Tuan: Visualization, Validation, Investigation, Writing – review & editing. Huynh Truc Phuong, Le Quang Luan, Pham Thi Thu Hong, and Tran Van Man: Visualization, Validation, Datacuration. All authors read and approved the final manuscript.
CONFLICT OF INTEREST
The authors declare that they have no conflicts of interest.
ACKNOWLEDGMENTS
This research is funded by the Vietnam National Foundation for Science and Technology Development (NAFOSTED) under grant number 103.99-2020.59. The authors thank Dr. Luu Anh Tuyen (Center for Nuclear Techniques, Vietnam Atomic Energy Institute) for the PALS experiments.
DATA AVAILABILITY STATEMENT
The datasets are not publicly available but are available from the corresponding author upon reasonable request.