

Toward Plasmon-Controlled Generation of the Activating Ag Hotspot Nanospheres for Quantitative SERS Analysis
- Faculty of Physics and Physics Engineering, University of Science, Ho Chi Minh City 700000, Viet Nam
- Viet Nam National University, Ho Chi Minh City 700000, Viet Nam
Abstract
Introduction: Surface-enhanced Raman scattering (SERS) has attracted enormous concern as a robust vibrational spectroscopy technique with widespread applications, primarily for the ultrasensitive detection of low-concentration molecules and selective identification. Nevertheless, the optimization of SERS efficiency has been impeded by limitations in controlling the size of nanoparticles utilized in this technique. Method: In this study, the morphology, structure, chemical components, and optical properties of the as-synthesized Ag nanoparticles (Ag NPs) via a hydrothermal method were thoroughly investigated by sophisticated analyses. The synthesized Ag NPs were characterized for its morphological characteristics using scanning electron microscopy (SEM), energy dispersive X-ray spectroscopy (EDX), transmission electron microscopy (TEM), X-ray diffraction (XRD), UV-Vis absorption spectroscopy, Raman spectroscopy, and assessed for their SERS performance in detecting organic substances including Crystal Violet (CV) and Rhodamine B (RhB). Results: The results showed that Ag NPs with different sizes could be obtained from 10 to 30 nm. These sizes corresponded to the duration of the hydrothermal method, which was 15, 20, and 25 hours, respectively. The optimal sample exhibited the capability to detect dye molecule solutions at diluted-low concentrations as low as 10-8 M. Conclusion: Through these results, we contribute to advancing the understanding of tailored nanoparticle synthesis for superior SERS performance, thus opening avenues for enhanced molecular detection in various applied analytical fields.
INTRODUCTION
Raman scattering is a credible analytical tool that detects minuscule quantities of many different substances. This technique achieves this by accessing the unique spectral fingerprint of a substance's vibrational modes through inelastic Raman scattering 1, 2. Raman spectroscopy has gained widespread acceptance as it capitalizes on the advanced growth of laser and detector technologies in the visible wavelength range. However, the limitations induced by the third-order nonlinear process resulted in low efficiency and sensitivity of Raman signals. Thus, several techniques have been developed to enhance Raman detection3. One of the most well-known powerful enhancement strategies currently in use is SERS, a potential label-free and nondestructive tool for molecular and chemical analytical sensing owing to its high sensitivity and ability to reach the single molecule detection limit4, 5, 6, 7, 8, 9. Over the past decade, most research on SERS platforms has emphasized using noble metals based on the electromagnetic enhancement (EE) mechanism10. This mechanism has attained noteworthy Raman enhancement factors because of the intense localized surface plasmon resonance (LSPR), particularly up to ~109. This effect is strongly dependent on the shapes of plasmonic nanoparticles that are mainly derived from the "hot spots" at the ultrasmall interparticle gaps related to the noble metals11, 12. Metallic nanostructures are essential for enhancing the sensitivity of SERS sensors. Most researchers prefer silver nanoparticles as SERS-active substrates due to their superior performance when compared to gold and copper. The varied morphologies of silver nanoparticles significantly influence the SERS performance of the sensor. Ag NPs are extensively employed to create active substrates for SERS effects thanks to their controllable shape, allowing fine-tuning of the LSPR properties. Therefore, this enables optimization of the SERS responses in numerous cases.
Currently, there are enormous synthesis protocols to fabricate Ag NPs, including techniques such as lithography, laser ablation, chemical reduction, and sputtering 13, 14, 15, 16. Cheng et al. created colloidal silver nanoaggregates (AgNAs) of various sizes. The consistent SERS signal enabled accurate detection. Their solution of AgNAs allowed precise identification of 5-nitro-8-hydroxyquinoline at a concentration as low as 3 x 10 M 17. Atta et al. developed a highly stable solution of polyvinylpyrrolidone (PVP)-capped bimetallic silver-coated gold nanostars (BGNS-Ag-PVP) for SERS performance. This nanoprobe generated a robust and consistent SERS signal when analyzed with a portable Raman instrument. The SERS sensor showcased the practical application of these bimetallic nanoparticles by accurately detecting methimazole (Mz), an antithyroid drug used as a model analyte. They achieved an impressive detection limit of 1 nM for Mz in human urine samples18. Despite remarkable growth in these methodologies, the necessity for advanced equipment remains a challenging aspect. Regrettably, a significant issue still persists: the large sizes of these aggregated silver nanoparticles lead to the formation of numerous substantial gaps around them, considerably diminishing the effective amount of electromagnetic active regions. Additionally, all the aforementioned techniques employed to create SERS platforms involve the integration of plasmonic nanostructures through a method of fabricating Ag NPs. This results in intricate procedures, consumes substantial time, and constrains their feasibility. Among these, wet chemical reduction is a widely used method in producing Ag NP solutions. The mechanism of this method is to reduce silver ions (Ag) in silver salt using sodium borohydride or sodium citrate as a reducing agent 19, along with the addition of a surfactant agent such as poly(vinyl alcohol) (PVA)20, poly(vinyl pyrrolidone) (PVP) 21, and cetyltrimethylammonium bromide (CTAB) 22, 23. This method offers several advantages, such as (i) easy control of the morphology of the Ag NPs by utilizing various reducing factors and surfactants during preparation and (ii) facile synthesis in the practical growth process of the Ag NPs24. Most previous research has primarily focused on the impact of reducing agents and surfactants on the final morphology of Ag NPs, with little attention given to controlling the hydrothermal time. Herein, Ag NPs with different sizes will be synthesized using the hydrothermal method with various reaction times.
EXPERIMENTAL SECTION
Chemicals and reagents
All chemicals and reagents used in this study were high grade. Silver nitrate (AgNO, 99.8%), poly(vinyl pyrrolidone) (PVP, MW=40,000), crystal violet (CV, CHNCl), and rhodamine B (RhB, CHClNO) were purchased from Sigma‒Aldrich. Ethanol (CHOH, 99.0%) was supplied by Xilong Scientific. Deionized (DI) water was used in all experimental processes.
Synthesis of Ag NPs with different shapes
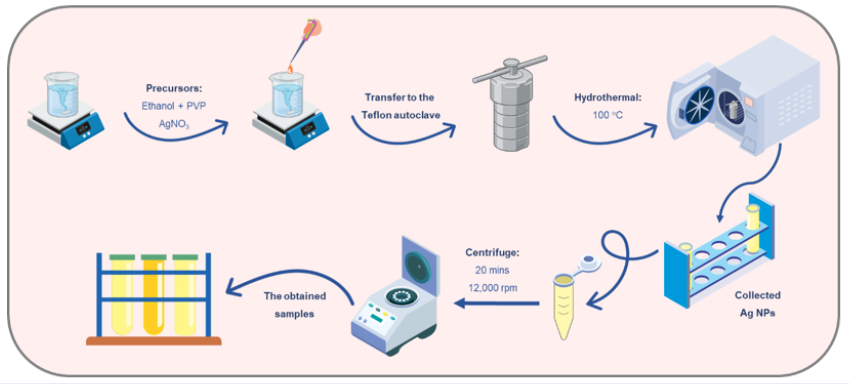
Ag NPs ranging from 15 to 40 nm in diameter were prepared through a one-step hydrothermal reaction in ethanol as the solvent, with the presence of the surfactant agent PVP25. PVP (0.17 g) was dissolved in 20 mL of ethanol for 10 minutes before adding 0.3 g of AgNO. The solution turned light-yellow with stirring within 15 minutes. Afterward, the above mixture was transferred to a Teflon-lined autoclave and incubated at 100°C for different reaction times (15 h, 20 h, and 25 h, denoted as Ag-15, Ag-20, and Ag-25, respectively). After naturally cooling to ambient conditions, the as-prepared Ag NPs were purified by removing the excess agents by centrifugation at 12,000 rpm for 20 minutes and washed in DI water several times. The colloidal Ag NPs were then dispersed in 5 mL of DI water for further optical and structural evaluation (Figure 1).

Schematic depiction of the Ag NP fabrication process through the hydrothermal method
Optical and surface morphological characterization
To examine the morphological characteristics of the synthesized samples, we used a field emission scanning electron microscope (FE-SEM, S-4800, Hitachi) and a transmission electron microscope (TEM, JEOL 1010, JEOL). The chemical composition was analyzed using energy-dispersive X-ray spectroscopy (EDX). X-ray diffraction (XRD) with Cu Kα radiation was used to evaluate the phase and crystallinity. All UV−Vis absorbance spectra presented in this study were obtained using a UV−Vis spectrometer (V-690, JASCO, Inc.) to explore the plasmon resonance peaks. To study the SERS properties of the as-prepared Ag colloidal solution, a confocal micro-Raman system (Horiba XploRA PLUS) was used with an excited laser of 532 nm. The system was calibrated using a silicon wafer reference standard before collecting the spectra. Each Raman measurement involved a single exposure of radiation for 1 second, followed by an integration time of 2 seconds with a laser incident power of 1.5 mW with a 50 × objective lens. A series of CV and RhB molecule concentrations in standard ethanol was used as probe molecules. These molecules were thoroughly mixed with a preprepared colloidal solution of Ag NPs, and 10 µL of the resulting mixture was then drop-cast onto a copper slide and allowed to dry under ambient atmospheric conditions.
RESULTS
XRD analysis systematically evaluated the crystallinity of the Ag NPs. Figure 2(a) shows that the as-synthesized samples exhibited XRD diffraction peaks at 37.91° and 44.14°, corresponding to the (111) and (200) planes of Ag NPs (JCPDS No: 84-0713) (21). The intensity of the (111) signal is significantly higher than that of the other peak (200). This could be due to the formation of Ag NPs without a perfect shape. However, the (111) face signal was strong and dominant in the XRD pattern, implying that the orientation growth of Ag nanocrystals followed the (111) planes, thereby indicating the successful fabrication of the Ag solution through the hydrothermal method. Notably, no peak corresponding to impurity states was recorded in the XRD pattern, indicating that the Ag fabrication process did not generate contaminants. This result is consistent with published studies26, 27. To further examine the structure of the samples, Raman spectra were obtained with a 532 nm laser line. As shown in Figure 2(b), two Raman response modes at 1364 cm and 1544 cm were identified as those of the crystal phase of Ag NPs. These structural analysis results of the Ag NPs implied that the hydrothermal synthesis of Ag NPs could achieve high orientation and crystal growth28, 29.

Structural and compositional characterizations of the Ag solution. (a) XRD pattern of the as-prepared Ag-25 sample, (b) FT-Raman spectra of the Ag-25 sample.
The morphological characteristics of the Ag NPs were explored through SEM analysis, and the results are shown in Figure 3, revealing that the average diameter of Ag-15 was 15-20 nm. Increasing the reaction time to 20 and 25 hours resulted in larger Ag NPs with diameters of 20-30 nm and 30-40 nm, respectively. These findings indicated that as the hydrothermal reaction time increased, there was a corresponding growth in the diameter of the Ag NPs, as demonstrated in Figure 3 (a-c). The results underscored the substantial impact of the hydrothermal reaction on the size of the Ag NPs. Moreover, the shape of the Ag NPs may remain mostly the same with different reaction times and retain their spherical shape. To clearly observe the size and shape of Ag NPs, TEM analysis of the Ag-20 and Ag-25 samples was carried out (Figure 3 (d,e)); the analysis revealed the presence of Ag nanoparticles that were spherical in shape and varied in size from 20 to 30 nm and 30 to 40 nm, respectively. This result is consistent with the SEM image mentioned above. The change in Ag size followed by the hydrothermal time significantly influences the SERS behavior for detecting organic dyes at low concentrations based on the Ag NP-supported controllable diameter.

Morphology of the as-synthesized AgNPs. (a-c) SEM images of the Ag-15, Ag-20, and Ag-25 samples. (d-e) TEM images of the Ag-15, Ag-20, and Ag-25 samples, respectively.
To further analyze the chemical composition of the as-synthesized Ag NPs, we conducted an EDX analysis on a representative sample, with the corresponding results presented in Figure 4. The analysis indicated the appearance of distinct Ag, C, and O elements within the sample, and the corresponding weight percentages are provided in the table inset within Figure 4. The incorporation of C and O elements might be associated with the compositional characteristics inherent to PVP-capped Ag NPs.

EDX elemental component of the as-prepared Ag-25 sample
In Figure 5, the UV‒Vis absorbance spectra of various colloids containing Ag NPs are presented. This method allowed for the characterization of the LSPR profile of the substrates based on the position and width of the peak, suggesting that the LSPR properties of the materials also undergo changes with their morphology30, 31. Figure 5 exhibits an absorption band range from 410 nm to 450 nm, attributed to the LSPR of spherical Ag NPs32, 33, 34. Additionally, the absorbance intensity of the Ag NPs and the LSPR peak shifting also correlate with the reaction time. When the reaction time is increased, there is a more pronounced redshift in the absorbance spectra of the Ag NPs. In particular, the LSPR intensity of the Ag-20 sample was the highest among all the samples. The intensity, width broadening, and shift of the Ag absorbance peaks can be explained by the alterations in size and shape of the Ag samples, as demonstrated in Figure 3. An interesting observation is the higher redshift trend observed in the Ag-25 sample, which can be attributed to the significant increase in nanoparticle size, consistent with the morphological analysis results mentioned above. This phenomenon is thought to be explained by plasmon coupling with the surrounding NPs, and the higher concentration of neighboring NPs seems to influence Ag-25 behavior in this regard35. As a result, the efficiency of detecting organic dyes based on Raman scattering can be significantly affected.

UV‒Vis absorbance spectra of the various Ag NP samples with different hydrothermal times
The primary purpose of this study was to prepare and optimize SERS-active substrates, wherein CV and RhB were used as the reporter molecules in a standard solution with a series of concentrations to evaluate the SERS performance of the platforms. As depicted in Figure 6, the SERS data within the spectral range reveal significant fluctuations in the Raman signals for the as-synthesized samples at different hydrothermal time intervals. The typical peaks of CV molecules were clearly observed at the low concentration of 10 M (presented in Figure 6(a)). Certain CV characteristic peaks have been identified at wavenumbers 800, 908, 1166, and 1611 cm, which result from C-H bending vibrations, radical-ring skeletal vibrations, C-C-C bonding, and C-C stretching vibrations of the phenyl ring, respectively36, 37. The Raman characteristic peaks of the CV target molecules have been observed on the Ag-15 platform, showing relatively lower intensity compared to other samples. In contrast, the Ag-20 substrates exhibit a distinguishable Raman signal of CV molecules with the highest signal intensity. In comparison, the signal indicated by the Ag-25 platform shows a downward trend. Based on the results mentioned above, the Ag-20 substrate demonstrates the most effective SERS capability among the samples, which is attributed to the LSPR property of Ag-20 NPs being in maximum alignment with the molecular resonance condition of CV molecules. This implies that SERS-based sensors can be optimized for specific analytes by fine-tuning the particle size to match a specific resonance condition of the reporter molecules38. To assess the SERS enhancement factor of the three Ag samples using CV as the reagent, we focused on the characteristic peak at 1611 cm. The enhancement factor (EF) was calculated employing the following equation:
EF = (I × C)/(I × C)
Here, I and I represent the intensities of the Raman signals obtained from the Ag NP substrate and bulk CV powder, respectively. Similarly, C and C denote the concentrations of the probed solution in SERS and normal Raman, respectively.
Utilizing the provided equation, the EFs for the CV Raman resonance peak at 1611 cm were approximately calculated to be 9.7 × 10, 19.5 × 10, and 15.4 × 10 for Ag-15, Ag-20, and Ag-25, respectively.
The Ag-20 sample, which demonstrated superior SERS performance compared to the other samples with CV target molecules, was selected as the SERS platform for evaluating various concentrations of RhB solutions. As shown in Figure 6(b), the Raman spectral results revealed distinct characteristic peaks corresponding to the RhB molecules at 622, 1196, 1362, and 1648 cm. According to a previous report, these Raman vibrational peaks are attributed to C-C-C stretching, C-H in-plane bending, stretching of the bridge C-C aromatic, and C=C stretching vibrations, respectively 39. The concentration of RhB varied from 10 to 10 M, and the intensity of the obtained Raman peaks decreased gradually. The SERS peaks were still clearly observed even at the lowest concentration of 10 M RhB dye. Therefore, these findings strongly suggest that the as-synthesized Ag NPs via a hydrothermal strategy proved remarkably efficient in recognizing organic dyes with diverse compositions and concentrations. This indicates that the ability to fine-tune the hydrothermal synthesis times to achieve Ag nanoparticles with optimized sizes further facilitates the detection of trace amounts of target analytes.

(a) SERS response of the CV molecules with the various as-prepared Ag samples. (b) SERS spectra of RhB molecules with different concentrations from 10-6 to 10-8 M.
DISCUSSION
According to the preceding findings, the hydrothermal-supported Ag substrate suggests a possible mechanism of SERS behavior. The increased Raman signals observed for CV and RhB with the Ag NPs could be attributed to a strengthened electromagnetic field. This phenomenon, known as the EE effect, causes a substantial amplification of Raman signals for analytes when positioned at/or close to nanostructures composed of coinage metals. This amplification could reach several orders of magnitude. In addition to the EE effect, the resonant excitation of charge transfer (CT) between the metal and adsorbed molecules also plays a critical role in SERS signals22. As depicted in Figure 7, the addition of Au nanoparticles to create the metal level establishes new CT routes. The lowest unoccupied molecular orbital (LUMO) and the highest occupied molecular orbital (HOMO) levels of CV molecules are situated at −4.1 and −6.2 eV. Meanwhile, the E level of Ag is situated at −4.84 eV. When the molecules absorb light on the surface of Ag NPs excited by the laser, electrons can be initiated to move from the HOMO state of the CV molecules to the Ag NPs and then transfer to the LUMO state. The electrons in the LUMO state then return to the HOMO state, leading to the enhancement of the SERS signal. In particular, when the excitation energy of the laser corresponds to the transition from the Fermi level of Ag to the LUMO of the CV molecules (ΔE = 0.74 eV) or from the HOMO levels of the absorbed molecules to the metal level (ΔE = 1.36 eV), significant SERS enhancement can be achieved5. An excited laser with a wavelength of 532 nm (equivalent to 2.33 eV) could generate hot electrons and excite these transitions, resulting in enhanced SERS responses.

The electromagnetic enhancement of the Ag NP-supported SERS sensor for trace-molecule detection.
CONCLUSION
In this study, we employed a practical approach to fabricate Ag NPs through a carefully designed hydrothermal pathway and clarified the mechanisms responsible for the SERS effects. Through controlled synthesis, we obtained Ag NPs with varying sizes, each possessing distinct plasmonic properties that played a pivotal role in enhancing the performance of the EM, thereby amplifying the SERS effects. Furthermore, an aspect of our findings was the discernible impact of analyte interactions, leading to significant CT transitions between dye molecules and the metal nanoparticles. This dynamic interplay between analytes and Ag NPs fostered a conducive environment, resulting in intensified SERS effects and ultimately enhancing the sensing capabilities. The results revealed a clear trend: the diameter of the Ag NPs varied as the hydrothermal time was extended from 15 to 25 hours. Notably, the Ag NPs synthesized at the 20 hour mark exhibited sizes ranging from 20-30 nm, showcasing superior discernment of Raman signals compared to other samples. Moreover, the achieved Ag substrates demonstrated impressive capabilities in detecting solutions of CV and RhB at low concentrations, from 10 to 10 M, which can be further applied to other interdisciplinary fields.
COMPETING INTERESTS
The authors declare that there is no conflict of interest regarding the publication of this article.
AUTHORS’ CONTRIBUTIONS
Nguyen Tran Gia Bao conceived the current idea, executed the work, and wrote the manuscript with support and guidance from Ton Nu Quynh Trang and Vu Thi Hanh Thu.
Pham The Phuong conducted the experiments.
All authors have read and approved the final manuscript.
ACKNOWLEDGMENTS
This research is funded by Vietnam National University Ho Chi Minh City (VNU-HCM) under grant number VL2022-18-01.