

Modeling, impact evaluation, and optimization of machining performances of heat-treated SKD61 steel in a tungsten powder alloy mixed EDM process via the RSM-GRA methodology
- Advanced Technology Center, Le Quy Don Technical University, Hanoi, Viet Nam
- School of Mechanical Engineering, Hanoi University of Science and Technology, Hanoi, Vietnam
- Faculty of Mechanical Engineering, Hanoi University of Industry, Ha Noi, Viet Nam
- Advanced Technology Center, Le Quy Don Technical University Hanoi, Viet Nam
Abstract
Introduction: The participation of conductive powders in Electro-Discharge Machining (EDM) holds a great potential to improve the machining process. In this study, tungsten powder alloy added to the dielectric liquid during the EDM process, is called Powder Mixed EDM (PMEDM) to process heat-treated SKD61 steel was investigated. The aim of this study comprises: (i) considering the influence of essential process parameters, embracing pulse-on time (Ton), peak-current (Ip), and amount of powder (Ap) on tool wear rate (TWR) and material removal rate (MRR), and (ii) finding an optimation coalescence of the process variables for enhanced the MRR, and the reduced TWR. Methods: For this aim, the Box-Behnken matrix was adopted for the experiment design, and a series of 15 experiments has been performed to obtain empirical data. Subsequently, the adequate mathematical models for MRR and TWR were instituted, and the analysis of variance (ANOVA) was applied to assess these models' adequacy. Finally, grey relational analysis (GRA) was adopted for the multi-attribute optimization. Results: The results revealed that Ip proves the most robust influence on MRR and TWR. However, the proceeding influence is Ton and Ap for MRR, while this reverse is for TWR. The predictive models of MRR and TWR were constituted and validated with the adequacy/precision through coefficients (comprising “R2” of MRR and TWR corresponding to 0.9899 and 0.9918 , “R2(pred)” of MRR and TWR corresponding to 0.8504 and 0.8699, and “R2(adj)” of MRR and TWR corresponding to 0.9716 and 0.977). From the predictive models, the optimal responses and process variables, including MRRmax of 0.003397818(g/min), TWRmin of 0.000481408(g/min), peak-current of 5(A), pulse-on time of 150(µs), and powder concentration of 15(g/l) were found. In addition, the comparison of the micro-defects at the optimum electrical mode was conducted between having powder mode and having no-powder mode was conducted. As results, the surface obtained with the powder mode has fewer micro-cracks, voids, droplets, and smaller globules of debris than that of the surface obtained with the powderless mode. Conclusions: The results attained from evaluation of the influence of process parameters on the machining performances, establishment of a prediction model for the machining performances, and optimization of process parameters, which can be applied in factual mold manufacturing, and helps technologists and researchers having the most suitable choices. Besides, the methods applied in this study can be applied in the PMEDM process to study different powders and workpiece materials.
Introduction
Powder mixed into electrodischarge machining (PMEDM) was developed based on electrodischarge machining, and PMEDM has emerged as a potential machining method for enhancing machining performance and surface quality to process cut-difficult materials and ensure the execution of complex shapes 1, 2. PMEDM was born approximately four decades ago, and different powders were investigated. The influence of powders such as C, Fe, Cu, and Al on discharge properties, machining efficiency, and surface quality was first reported in 1981 by Erden . 3. Subsequently, different powders, such as Si, SiC, Gr, Mo, Cr, Ti, TiC, Al, Ni, and C, were investigated for their ability to enhance machining properties and surface quality 4. However, few studies on tungsten powder alloys subjected to EDM have been performed.
The types of materials used during the EDM process were also investigated with various powders, including SS304, Ti64, AISI D2 steel, AISI W1 steel, SKD61 steel, and AISI P20 steel, which are regularly used in industry. SKD61 steel is a kind of tool steel. In particular, its mechanical properties are evaluated to be superior to those of other steels treated with heat5, 6, 7. In the manufacturing sector, heat-treated SKD61 steel is applied in hot stamping dies, blow molds, plastic molds, etc.8. However, other machining methods, such as turning and milling, have difficulty cutting and obtaining low efficiency when this material is machined in the heat-treated state. The electroelectrical discharge (EDM) method has emerged as a potential machining method for this material state 1. With respect to SKD61 steel, there are several studies on this material with different powders. For instance, the surface attributes of SKD61 steel, including the surface roughness and thickness of the recast layer, were explored under conditions of EDM with added Al and surfactant powders9. The results revealed that the impact of Al and surfactant powders on the surface roughness (SR) and thickness of the recast layer is meaningful for improving the surface roughness. Another study of SKD61 steel with Cr and Al added to various dielectrics was reported10. This study revealed that factors such as peak current, pulse-on time, dielectric type, grain size, and the ratio of Al to Cr powder influenced the material removal rate (MRR), tool wear rate (TWR), SR, and microhardness (MH). Recently, tungsten carbide powder was investigated during EDM by Le .11, 12. These investigations have comprehensively explored surface attributes such as variations in compositional chemistry, SR, microcracks, MH, and the generation of alloy phases in surface layers and considered the electrical parameter domains where this powder has a positive or negative effect on surface modification. However, the material state of the abovementioned studies is the non-heat-treated state. Moreover, heat-treated SKD61 steel is commonly processed by the EDM method before further operation to obtain the complete set of molds.
As mentioned above, most of these investigations involve heat-untreated SKD61 steel, which is not amenable to practical manufacturing. Moreover, heat-treated SKD61 steel is commonly processed by the EDM method before further operation to obtain a complete mold set. In addition, in this study, the EDM process combined with tungsten compound powder suspended in an insulating solution has practical significance. Tungsten has very good physical and chemical properties at high temperatures when penetrating the surface. However, to date, this issue has received little attention from the research community. To fill the missing gap with tungsten powder alloy in the EDM process used to process heat-treated SKD61 steel, the obtained results provide and enrich necessary insights for the research community and are applied in the mold and component manufacturing industry. Hence, this study focused on developing predictive models of machining efficiency (TWR and MRR) by utilizing response surface methodology (RSM) for the machining of heat-treated SKD61 steel by an EDM process with the addition of a tungsten powder alloy. From the obtained prediction models, the impact of crucial process parameters on machining performance can be analyzed and evaluated. Additionally, RSM-Gray relational analysis (GRA) was performed to determine the optimal machining performance, which helps technologists and researchers determine the proper option in the manufacturing sector.
Materials and methods
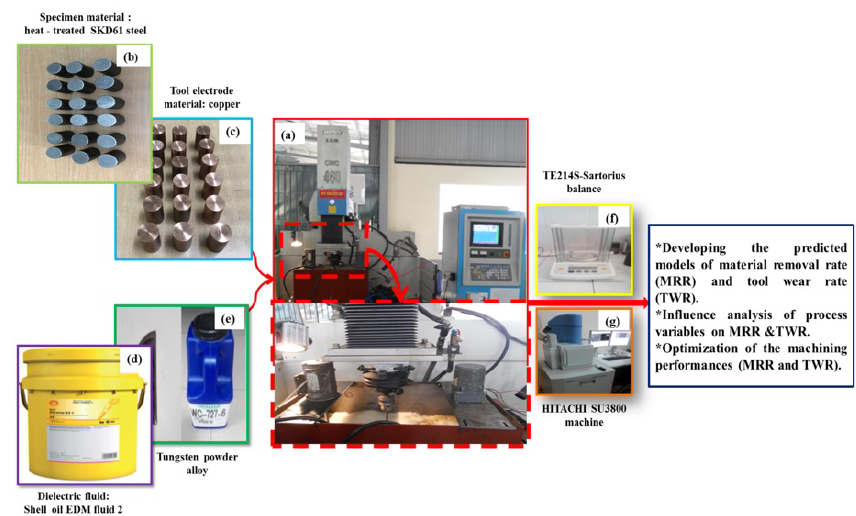
In Figure 1b, entire SKD61 steel specimens were machined to a size of 45x19 mm (height × diameter) with the nominal compositional chemistry given as 0.4Mn, 0.38C, 1 V, 1Si, 1.25Mo, 5Cr, and balanced Fe (in wt. %), and heat was applied to achieve a hardness of 50±2HRC. The trials were implemented on an EDM machine (CNC-460)-Aristech brand, and a reverse electrode of copper (99%Cu) was applied as a tool, as indicated in Figure 1a and Figure 1c. The grain size of the tungsten powder alloy is less than 31 μm, and the titular compositional chemistry is 82.5 W-11.9Co-5.56C- 0.02Fe-0.02 other composition (wt.%), which was evenly mixed into the dielectric fluid (EDM fluid 2 from Shell Company), as indicated in Figure 1d and Figure 1e.

Experimental diagram of investigation.
The peak current (I) and pulse-on time (T) of the EDM process strongly influence the machining performance 9. Therefore, I and T were considered to have a priming effect on machining performance, while the pulse-off time and current-voltage were held constant at 120 V and 50 µs, respectively. In addition, the amount of powder (A) also has a significant impact on machining performance. Hence, the essential parametric variables, namely, T, I, and A, were investigated in the experimental design. The empirical strategy was conducted on the Box‒Behnken plot of the RSM to reduce the number of experiments and reduce the empirical cost. Compared to other empirical statistical methods, the capability of Box–Behnken is to construct accurate models, the most preferable of which involve three factors and levels13. The levels of the machining parameters are described in
The levels of process parameters
|
Variables of process parametric |
Levels | ||
|
Ip (A) |
5 |
7 |
9 |
|
Ton (µs) |
50 |
100 |
150 |
|
Ap (g/l) |
0 |
15 |
30 |
MRR and TWR are computed by Eqs. (1) and (2), respectively. Here, W and W are the initial and finishing weights of the workpiece, respectively, and w1 and w2 are the tool electrode (g), respectively. The weights of the specimen and electrode were balanced by a Sartorius balance with respect to the TE214S code (a readability of 0.0001 g), as depicted in Figure 1f. The processing time in equations (1) and (2) is the duration needed to mutate the height of the samples from 45 mm down to 44.3 mm.
The microdefects on the surfaces obtained by PMEDM and EDM were explored on a HITACHI SU3800 machine by emission scanning electron microscopy (SEM), as indicated in Figure 1g.
The empirical matrix of the machining variables and achieved data of attributes are described in
Trial matrix and data of output
|
Run |
Process parameters |
Output variables | |||
|
Ton-m |
Ip-A |
Ap-g/l |
TWR- g/min |
MRR- g/min | |
|
Empirical data for developing models | |||||
|
1 |
50 |
9 |
15 |
0.001176108 |
0.003996503 |
|
2 |
50 |
5 |
15 |
0.000578622 |
0.001972537 |
|
3 |
100 |
9 |
30 |
0.001093224 |
0.003972222 |
|
4 |
100 |
7 |
15 |
0.000714120 |
0.002743987 |
|
5 |
100 |
7 |
15 |
0.000702218 |
0.002687734 |
|
6 |
150 |
9 |
15 |
0.000999094 |
0.004013167 |
|
7 |
50 |
7 |
30 |
0.000807356 |
0.002480000 |
|
8 |
100 |
5 |
30 |
0.000651593 |
0.002678663 |
|
9 |
50 |
7 |
0 |
0.000534151 |
0.001986364 |
|
10 |
100 |
9 |
0 |
0.000927740 |
0.003536138 |
|
11 |
150 |
7 |
30 |
0.000610508 |
0.003543158 |
|
12 |
100 |
5 |
0 |
0.000410404 |
0.002340698 |
|
13 |
100 |
7 |
15 |
0.000709320 |
0.002629356 |
|
14 |
150 |
7 |
0 |
0.000572218 |
0.002596923 |
|
15 |
150 |
5 |
15 |
0.000481408 |
0.003397818 |
|
Empirical data for testing accuracy of models | |||||
|
16 |
50 |
5 |
30 |
0.000658931 |
0.001913934 |
|
17 |
150 |
7 |
15 |
0.000609828 |
0.003084515 |
|
18 |
100 |
7 |
30 |
0.000775432 |
0.002704641 |
|
19 |
150 |
9 |
30 |
0.000977515 |
0.004504535 |
Results
Establishing the prediction models
The prediction models of the output features, including the MRR and TWR, were established. A regression model of the quadratic equation was constructed, as delineated by Eq. (3):
where ʎ, ʎ, ʎ, and ʎ are the coefficients of the regression models; x and x are process parameters; the variable number is n, with n = 3; and the output property is – i.e., MRR or TWR. In this study, the coefficients, regression models and analysis of variance (ANOVA) were computed and established with Minitab 19 software. The adequacy of the predictive models for MRR and TWR are delineated in the equations. (4) and (5), respectively, while the ANOVAs for MRR and TWR are described in the corresponding
MRR=0.004438+ 0.000023T - 0.001332I +0.000014A – 3.52154x10 TI +1.50866x10 TC+8.17656x10IC+0.000142I+3.55322x10T-5.52202x10A (4)
TWR=0.000829+3.06562x10T- 0.000261I + 0.000026A - 1.995x10TI - 6.30875x10 IA-7.83051TA-7.88531x10T+0.00003I – 2.56805x10A (5)
ANOVA for the predictive model of the MRR
|
Source |
Sum of Squares |
Mean Square |
p value |
F value |
Remark |
Contribution |
|
Model |
6.976E-06 |
7.751E-07 |
0.0002 |
54.19 |
significant | |
|
Ip |
3.287E-06 |
3.287E-06 |
< 0.0001 |
229.81 |
significant |
46.64% |
|
Ton |
1.213E-06 |
1.213E-06 |
0.0003 |
84.82 |
significant |
17.22% |
|
Ap |
6.127E-07 |
6.127E-07 |
0.0012 |
42.83 |
significant |
8.69% |
|
Ip x Ton |
4.961E-07 |
4.961E-07 |
0.0020 |
34.68 |
significant |
7.04% |
|
Ip x Ap |
2.407E-09 |
2.407E-09 |
0.6987 |
0.1683 |
not significant |
0.03% |
|
Ton x Ap |
5.121E-08 |
5.121E-08 |
0.1170 |
3.58 |
not significant |
0.73% |
|
Ip2 |
1.196E-06 |
1.196E-06 |
0.0003 |
83.61 |
significant |
17.31% |
|
Ton2 |
2.914E-08 |
2.914E-08 |
0.2129 |
2.04 |
not significant |
0.51% |
|
Ap2 |
5.700E-08 |
5.700E-08 |
0.1024 |
3.98 |
not significant |
0.81% |
|
Lack of Fit |
6.495E-08 |
2.165E-08 |
0.1346 |
6.59 |
not significant |
0.92% |
|
“R2” = 0.9899, “ R2(adj)” = 0.9716, and “R2(pred)” = 0.8504 | ||||||
ANOVA for the predictive model of the TWR
|
Source |
Sum of Squares |
Mean Square |
p value |
F value |
Remark |
Contribution |
|
Model |
7.145E-07 |
7.939E-08 |
0.0001 |
67.05 |
significant | |
|
Ip |
5.378E-07 |
5.378E-07 |
< 0.0001 |
454.18 |
significant |
74.65% |
|
Ton |
2.344E-08 |
2.344E-08 |
0.0067 |
19.79 |
significant |
3.25% |
|
Ap |
6.447E-08 |
6.447E-08 |
0.0007 |
54.45 |
significant |
8.95% |
|
Ip x Ton |
1.592E-09 |
1.592E-09 |
0.2986 |
1.34 |
not significant |
0.22% |
|
Ip x Ap |
1.433E-09 |
1.433E-09 |
0.3214 |
1.21 |
not significant |
0.2% |
|
Ton x Ap |
1.380E-08 |
1.380E-08 |
0.0190 |
11.65 |
significant |
1.92% |
|
Ip2 |
5.314E-08 |
5.314E-08 |
0.0011 |
44.88 |
significant |
8.16% |
|
Ton2 |
1.435E-09 |
1.435E-09 |
0.3211 |
1.21 |
not significant |
0.12% |
|
Ap2 |
1.233E-08 |
1.233E-08 |
0.0233 |
10.41 |
significant |
1.71% |
|
Lack of Fit |
5.848E-09 |
1.949E-09 |
0.0181 |
54.37 |
significant |
0.81% |
|
“R2” = 0.9918, “ R2(adj)” = 0.977, and “R2(pred)” = 0.8699 | ||||||
Influential exploration of the manufacturing process variables on the MRR&TWR
The main impacts of single processing parameters on the MRR and TWR are described in the Figure 2a and Figure 2b, respectively. Moreover, the combined impacts of the machining variables on the MRR and TWR are depicted in the Figure 3a–c and Figure 4a–c, respectively. The pairs of factors considered for the combined impact on MRR and TWR in this study included I and T, I and A, and T and A. The results (as indicated in

Main influence of process parameters on MRR and TWR: (a) MRR; (b) TWR.

The incorporated influences of process parameters on MRR: (a) Ip and Ton, (b) Ip and Ap, and (c) Ton and Ap.

The incorporated influences of process parameters on TWR: (a) Ip and Ton, (b) Ip and Cp, and (c) Cp and Ton.
Validation of the computational models
In this investigation, the empirical data from 16 to 19 (as indicated in
Comparing between empirical values (EV) and predictive values (PV)
|
No. |
TWR, g/min |
MRR, g/min | ||||
|
PV |
EV |
Error (%) |
PV |
EV |
Error (%) | |
|
16 |
0.0006934 |
0.000658931 |
4.97 |
0.0019772 |
0.001913934 |
3.2 |
|
17 |
0.0006347 |
0.000609828 |
3.92 |
0.0031653 |
0.003084515 |
2.55 |
|
18 |
0.0007405 |
0.000775432 |
4.71 |
0.0028395 |
0.002704641 |
4.75 |
|
19 |
0.0009483 |
0.000977515 |
3.08 |
0.0043135 |
0.004504535 |
4.43 |
|
Error(%)=Abs (PV-EV)/PV× 100% | ||||||
Optimization of the machining performance
In the PMEDM process, the machining performance is expected to meet the following criterion: the MRR is obtained at the maximum, while the TWR is acquired at the minimum. Hence, the issue of optimizing the machining performance is represented as follows:
When x = [T, I, A] is found, the MRR and TWR simultaneously reach the minimum and maximum, respectively.
The process parameters were as follows: 50 ≤ ≤ 150 (µs), 5 ≤ ≤ 9 (A), and 0 ≤ ≤ 30 (g/l).
This problem was resolved by applying gray relational analysis (GRA). The steps to perform the GRA are indicated in Figure 5:

The calculation steps of the GRA algorithm.
All the GRC and GRG values corresponding to ranks are depicted in
GRA for MRR and TWR
|
Run |
GRCs |
GRG | ||
|
MRR |
TWR |
Value |
Rank | |
|
1 |
0.9839306 |
0.3333333 |
0.6586320 |
6 |
|
2 |
0.3333333 |
0.6947430 |
0.5140381 |
11 |
|
3 |
0.9614190 |
0.3592588 |
0.6603389 |
5 |
|
4 |
0.4456508 |
0.5576316 |
0.5016412 |
12 |
|
5 |
0.4349637 |
0.5674689 |
0.5012163 |
13 |
|
6 |
1.0000000 |
0.3940663 |
0.6970332 |
2 |
|
7 |
0.3995779 |
0.4909593 |
0.4452686 |
15 |
|
8 |
0.4332881 |
0.6135046 |
0.5233963 |
10 |
|
9 |
0.3348458 |
0.7557299 |
0.5452879 |
9 |
|
10 |
0.6814166 |
0.4253023 |
0.5533594 |
8 |
|
11 |
0.6846263 |
0.6567425 |
0.6706844 |
4 |
|
12 |
0.3789070 |
1.0000000 |
0.6894535 |
3 |
|
13 |
0.4244016 |
0.5615576 |
0.4929796 |
14 |
|
14 |
0.4187524 |
0.7029110 |
0.5608317 |
7 |
|
15 |
0.6237927 |
0.8435539 |
0.7336733 |
1 |
Discussion
The accuracy of the MRR and TWR development models was considered via analysis of variance (ANOVA) with 95% confidence and 5% significance.
Considering the influences of single factors and combined factors, Figure 2a reveals that A, I, and T have the same impact on the MRR. An increase in the MRR occurs when I, T, and C in the whole design space increase. This finding indicates that the MRR is ameliorated. Indeed, when I or T increase, thermal energy is generated in the discharge channel15, 16, 17. Furthermore, as the discharge zone expands, the conductive particles in the discharge channel are rooted 18. This boosts the MRR. In Figure 2b shows the crucial impacts of the variables on the TWR. This indicates that the TWR increases with increasing I or C in the entire design space. Moreover, the increase in T in the entire design space reduces the TWR. In regard to the impact of the combined factors, see the Figure 3a–c, the MRR increases with increasing I for all the values of T and A (Figure 3b–c). 3a and b), and with a rise in T for all values of I and A (Figure 3a and c). In addition, the increase in A also causes an increase in the MRR for all values of I (Figure 3b) and for all values of T (Figure 3c). The MRR obtained the greatest value when A, T, and I achieved the highest values. The results for the combined impacts of the process variables on the TWR reveal that the TWR increases with increasing I for all values of T and A (Figure 1). 4a and b), and with an increase in A for all the values of I and T (Figure 4b). 4b and c). At the smallest values of T, I, and A, the TWR obtains the minimum value. From the abovementioned evaluation, it is clear that both I and/or T increase, causing the discharge energy to increase and leading to increases in the MRR and TWR19, 20. In addition, adding powder particles to the working liquid produces stratified discharge, which increases the MRR and decreases the TWR 21. A combination of I and T leads to a low/high density of powder particles in the next discharge. This has a positive/negative influence on the improvement in MRR and TWR.
The optimization results are obtained via the GRA algorithm. To confirm the correctness of the algorithm for predicting optimal results. The values of MRR and TWR obtained by experiment at the optimum process parameters are presented in
Verification experiments of the results at the optimal process parameters
|
Machining attributes |
Optimum process parameters |
EV |
PV |
Error (%) |
|
TWR(g/min) |
Ip = 5A, Ton = 150µs, Cp = 15 g/l |
0.000501408 |
0.000481408 |
4.15 |
|
MRR(g/min) |
0.00334667 |
0.003397818 |
1.5 | |
|
Error (%) = Abs (PV − EV)/PV × 100% | ||||

Microdefects on surfaces: (a) at optimal process parameters without powders; (b) at optimal electrical parameters with powders.
In this study, the machining performance of heat-treated SKD61 steel by an EDM process with a tungsten powder alloy was investigated. Evaluation of the influence of process parameters on machining performance, establishment of a prediction model for machining performance, and optimization of process parameters were carried out. The following principal conclusions have been drawn:
-
Regression models were established, and ANOVA was performed to evaluate the precision of these development models (MRR and TWR). The outcomes indicated that the regression models have high precision and can be utilized to investigate the influences of process variables on machining performance and to predict the desired MRR and TWR in the entire design space.
-
The optimal responses and process variables, including an MRRmax of 0.003397818 (g/min), a TWRmin of 0.000481408 (g/min), a peak current of 5 (A), a pulse-on time of 150 (µs), and a powder concentration of 15 (g/l), were found through the RSM-GRA methodology.
-
In addition, the number of microdefects on machined surfaces determined by PMEDM is better than that on machined surfaces determined by EDM at the optimum electrical parameters.
-
Moreover, the prediction method of this study could be utilized for machining performance prediction for other steel alloys.
-
In future works, surface features such as the thickness of the recast layer, percentage of microcracks on surfaces, and surface topography of heat-treated SKD61 steel will be investigated for the applicable manufacturing industry.
List of abbreviations
EDM: Electronecharge Machining
PMEDM: Powder Mixed Electrodischarge Machining
MRR: Material removal rate
TWR: Tool wear rate
ANOVA: Analysis of variance
GRA: Gray relational analysis
SR: Surface roughness
MH: Microhardness
RSM: Response surface methodology
EV: Empirical values
PV: Predictive values
GRC: Gray relational coefficient
GRG: Gray relational grade
Competing Interests
The authors declare that they have no conflicts of interest.
Acknowledgments
This research is funded by the Vietnam National Foundation for Science and Technology Development (NAFOSTED) under grant number 107.99-2021.29.
Authors’ contributions
Van-Tao Le: Proposal and designed study; Van-Tao Le, Tien Long Banh, Thi Hong Minh Nguyen, Tien Dung Hoang, Van Thuc Dang , Hoang Cuong Phan: Performed experiments, Wrote and prepared the original manuscript; Van-Tao Le, Tien Long Banh, Thi Hong Minh Nguyen, Tien Dung Hoang: Reviewing and Editing. All authors read and approved the final version of the manuscript for publishing.