

Investigating the effect of synthesis parameters on the structure and upconversion luminescent properties of NaYF4:Tm,Yb for anticounterfeiting printing ink
- Faculty of Materials Science and Technology, University of Science, Ho Chi Minh City, Vietnam
- Vietnam National University Ho Chi Minh City, Vietnam
Abstract
Introduction: In this study, NaYF4:Tm,Yb upconversion microparticles were prepared by a hydrothermal method.
Methods: The effects of fabrication parameters such as rare earth concentration, reaction temperature and reaction time on the structure and luminescence properties of the materials were studied by X-ray diffraction (XRD), Raman spectroscopy, scanning electron microscopy (SEM), and photoluminescence spectroscopy (PL). Depending on the reaction temperature and time, the morphology of NaYF4:Tm,Yb is either a nanoparticle or a branched structure.
Results: The crystallite size is approximately 70 nm and remains almost unchanged with increasing reaction temperature and time. These NaYF4:Tm,Yb powders strongly emit at 450 nm and 798 nm. In addition, the surface of the UCMPs was also modified with maleic anhydride to improve their dispersibility in solvents and binding to biological molecules.
Conclusion: Printing ink based on UCMPs modified with maleic anhydride and polyamide for screen printing was prepared. The printed patterns on paper and polymer substrates glow blue light under LED excitation at 980 nm, and they are completely transparent in daylight.
INTRODUCTION
In recent years, rare earth-doped luminescent materials have received much attention from scientists because of their interesting properties, such as long fluorescence lifetimes1, narrow luminescent bands2, and different visible color emissions3. Among these materials, upconversion microparticles (UCMPs) can be emitted in the visible region under near infrared (NIR) excitation. In addition, NIR excitation light can penetrate biological molecules. Therefore, due to their outstanding properties, UCMPs have been applied in biomedical applications such as immunoassays4, fluorescence resonance energy transfer (FRET) sensors5, display screens6, anticounterfeits7, neurotransmitters8, and biomaging9.
UCMPs are prepared from rare earth (RE) ions doped in different host matrices, in which the fluoride host matrix is the most popular owing to its low phonon cutoff energy (~360 cm)10. This will reduce the nonradiative recombination process and increase chemical stability11, 12. NaYF crystals form cubic (α) and hexagonal (β) structures, in which the hexagonal structure has a higher luminescence efficiency than the cubic structure13, 14.
To date, different methods have been used to prepare UCMPs, such as sol–gel15, 16, coprecipitation17, 18 and hydrothermal methods 19. In our previous work, NaYF:Er,Yb UCMPs based printing inks were prepared, and the printed patterns are visible in green under 980 nm excitation1, 20, 21. To address the potential of this NaYF matrix and luminescent materials using NIR excitation for biomedical applications, we continued developing NaYF:Tm,Yb UCMPs by a hydrothermal method at 180C. Moreover, the influence of preparation parameters such as reaction temperature, reaction time, and doping concentration on the crystal phase, morphology, and luminescent properties of NaYF:Tm, Yb UCMPs was studied in detail. Tm and Yb play important roles in UCMPs. While Yb ions are sensitizers due to their large absorption cross section at 980 nm, Tm ions are active centers with a blue band at 450–470 nm and infrared emission at 800 nm. In addition, maleic anhydride-modified UCMPs NaYF:Tm, Yb based luminescent ink solutions were prepared to print patterns on paper using screen printing techniques. These blue patterns are obtained under an LED of 980 nm but are transparent under daylight.
MATERIALS & METHODS
MATERIALS
All chemicals and reagents were of high grade. Chloroform (CHCl), stearic acid (CHCOOH, > 99.9%), sodium hydroxide (NaOH, >99.5%), sodium fluoride (NaF, >99.9%), and ethanol (CHOH, >99.9%) were supplied by Merck, Germany. Oleic acid (CHCOOH, > 99.0%), yttrium nitrate hexahydrate (Y(NO).6HO, >99.9%, ytterbium nitrate pentahydrate (Yb(NO).5HO), and thulium nitrate pentahydrate (Tm(NO).5HO) were provided from Sigma‒Aldrich. Maleic anhydride, benzoyl peroxide and toluene were obtained from China.
METHODS
Preparation of NaYF :RE
The hydrothermal synthesis of the NaYF:1Tm,xYb samples (with 1 mol% Tm and x = 10, 20 and 30 mol% Yb) was carried out in two stages. Details of the procedure have been described in detail in our previous studies20, 22, 23.
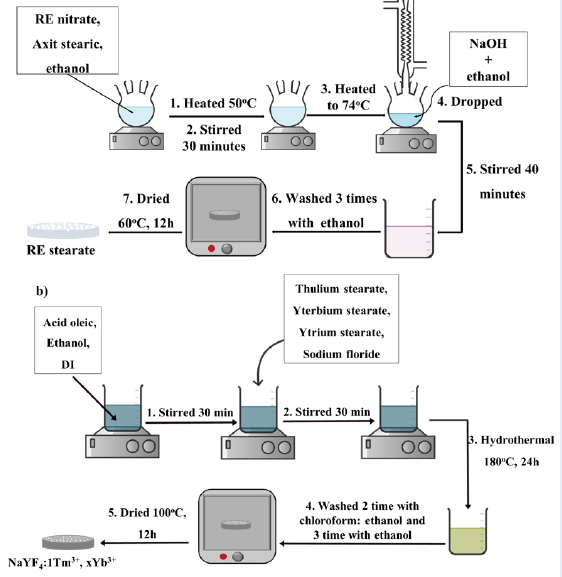
Stage 1: Preparation of RE stearate (Figure 1a).
First, RE(NO)⋅6HO, stearic acid, and ethanol were mixed and stirred at 54°C for 30 minutes. Then, NaOH solution was added at 74°C, and the precipitate was collected after 40 minutes. Next, the precipitate was washed with ethanol and dried at 60°C for 12 hours. Finally, RE stearate (RES) was obtained as a white powder. The chemical reactions are described as (1) and (2):
RE(NO) + 3NaOH → RE(OH) + 3NaNO (1)
RE(OH) + 3CHCOOH → (CHCOO) RE + 3HO (2)
Stage 2: Preparation of NaYF:RE nanoparticles by a hydrothermal method (Figure 1b).
First, water, ethanol, and OA were mixed vigorously for 30 min. Then, the appropriate amounts of RES and NaF were added, and the mixture was stirred for 30 min. Next, a hydrothermal process took place in an autoclave at 180°C or 200°C for different reaction times (24, 36, 48 h). A yellowish solution was obtained, centrifuged, and washed with chloroform and ethanol at a ratio of 1:6 (v/v). The suspension was subsequently dried at 100°C for 12 h. Finally, NaYF-codoped Tm and Yb nanoparticles were obtained.

Manufacturing of UCMPs NaYF4:Tm, Yb (a) Stage 1: Preparation of RE stearate and (b) Stage 2: Preparation of NaYF4:1Tm, 30Yb
Preparation of NaYF :RE @MA
The surface modification of NaYF:Tm, Yb microparticles with maleic anhydride (MA) through a maleicization process was carried out in our previous work 21.
First, UCMPs and MA, benzoyl peroxide (BPO), and toluene were added into a Schlenk flask. Then, nitrogen gas was continuously bubbled into the empty part of the flask and into the solution for 1 h. Then, the system was heated to 92°C and stirred at 300 rpm/min for 4 h, and oil was used as the heat conductor. The suspension was washed and dried at 100°C for 12 h. Finally, a white powder was obtained, which was NaYF:Tm, Yb modified with MA.

Surface modification process of UCMPs with MA
Process for manufacturing luminescent ink
Luminescent printing ink was prepared by combining UCMPs and polyamide (PA). A mixture of 10 g of PA and 30 ml of formic acid was stirred at room temperature for 5 h, and the resulting mixture was named mixture 1. Next, 42 ml of ethanol was added to mixture 1, which was subsequently heated to 60°C and stirred at 300 rpm for 30 min to obtain mixture 2. Then, 10 ml of n-propyl acetate, 5 ml of propanol, and 1 ml of dibutyl phthalate were added to mixture 2 and stirred at 300 rpm for 1 h to obtain a transparent solution. Finally, the printing ink was obtained by mixing UCMPs and a solution of PA at a weight percentage of 97:3.
Characterization
The structure of the UCMPs was studied by X-ray diffraction (XRD) on a BRUKER XRD-D8 ADVANCE instrument (Germany) using CuK rays with a wavelength l of 1.5418 Å. In addition, based on the combination of X-ray diffraction (XRD) data and the Langford model, the crystallite size of NaYFwas determined from the diffraction angle (θ) and the half-width (FWHM, β) through the following formula24:
With
Raman spectra were collected with an Xplora instrument (Horiba-Jobin Yvon) under 532 nm excitation. Fourier transform infrared (FT-IR) spectra from 400 to 4000 cmwere obtained on a Bruker Vertex70. Photoluminescence (PL) spectra were measured on a Nanolog spectrometer (Horiba) using a xenon excitation lamp source at a wavelength of 980 nm. The PL measurement conditions are similar for all the samples.
RESULTS
Effect of reaction temperature on the morphology, structure, and luminescence of NaYF :Tm, Yb UCMPs
The influence of reaction temperature on the crystal structure of NaYF:1Tm, 30Yb was investigated by XRD. Figure 3 shows the patterns of the samples prepared at 180°C and 200°C for 24 h. The XRD patterns of the powder at 180°C exhibit diffraction peaks at 2θ = 17.25°, 30.03°, 30.92°, 34.80°, 39.75°, 43.59°, 46.57°, 52.27°, 53.23°, 53.78°, and 55.54°, corresponding to the (100), (110), (101), (200), (111), (201), (210), (102), (300), and (211) lattice planes of the hexagonal structure of β NaYF (JCPDS 16 – 0334), respectively. Moreover, there are peaks at the (111) and (220) positions of the cubic structure of α-NaYF (according to JCPDS 77-2042). However, these two peaks corresponding to the cubic structure disappear for the samples synthesized at 200°C. This observation indicates that increasing the reaction temperature promotes the transition from the cubic to the hexagonal phase of NaYF. Furthermore, the crystal size was 72 nm and almost unchanged when the reaction temperature was increased to 200°C.

XRD patterns of NaYF4:1Tm, 30Yb prepared at 180°C and 200°C for 24 h.
SEM images of the NaYF:1Tm, 30Ybpowders at 180°C and 200°C for 24 h are shown in Figure 4. For the sample prepared at 180°C, the SEM images revealed two rod morphologies, one with a size of micrometers and one with tiny particles with a size of approximately 20–30 nm. However, only micrometer rods are observed in the SEM images of the 200°C sample. Based on this behavior and the XRD results, it can be assumed that the micrometer rods are hexagonal crystals and that the tiny particles are cubic. The morphology of NaYF:Tm,Yb strongly depends on the reaction temperature.

SEM images of NaYF 4:1Tm, 30Yb powder prepared at 180°C (a, b) and 200°C (c, d) for 24 h.
The influence of reaction temperature on the optical properties of the NaYF:1Tm, 30Yb samples prepared at 180°C and 200°C for 24 h was studied by PL. Figure 5a shows the luminescent spectra under 980 nm excitation. Both samples exhibit bands ranging from the visible to the NIR region of Tmions. The integral intensity values were calculated and are presented in Figure 5b. The intensity of the emissions increases significantly with increasing reaction temperature. This is explained by the fact that at a reaction temperature of 200°C, the sample only forms a hexagonal structure, which leads to enhanced luminescence of the powder. This result is identical to those reported by other authors25.
In addition, we used a CIE 1931 image (Figure 5b - inset) to show the luminescence of the sample when the hydrothermal temperature was changed. The results show that the reaction temperature has a negligible effect on the luminescent color of the samples.

a) Emission spectra of NaYF4:1Tm,30Yb, b) the integral intensities as a function of reaction temperature and CIE 1931
Effect of reaction time on the morphology, structure, and optical properties of NaYF:Tm, Yb UCMPs
Figure 6 shows the XRD patterns of NaYF:1Tm, 30Yb prepared at 180°C for different times. The XRD results of the UCMPs prepared for 24 h exhibited diffraction peaks corresponding to the hexagonal structure (β-NaYF) and two peaks relating to the (111) and (220) crystal planes of the cubic structure (α-NaYF). However, when the reaction time increases to 36 and 48 hours, the two peaks characteristic of the cubic crystal structure do not appear. Thus, increasing the reaction time can also support the formation of the hexagonal crystal structure of UCMPs. In addition, the crystallite size of NaYF is 72 nm and remains almost constant with different reaction times.

XRD patterns of sample NaYF4: 1Tm, 30Yb reacted at 180°C for 24, 36 and 48 h.
The morphology of the NaYF:1Tm, 30Yb powders at 180°C for reaction times of 24 hours and 48 hours is shown in the SEM image (Figure 7). SEM images showing the characteristic rods of the β NaYFcrystal structure. At 24 h, the hydrothermal sample also has tiny particles characteristic of the cubic crystal structure of NaYF which is completely consistent with the XRD data analyzed above. Based on these results, it can be concluded that the morphology of NaYF:Tm,Yb strongly depends on the reaction temperature.

SEM images of β NaYF4: 1Tm, 30Yb prepared at 180°C for a, b) 24 h and c, d) 48 h.
The photoluminescence spectra of the NaYF:1Tm, 30Yb samples prepared at 180°C for reaction times of 24 h, 36 h, and 48 h are shown in Figure 8a. The emission spectra were monitored by pumping at 980 nm. All samples exhibit emissions in the visible and NIR regions related to the transitions of the Tm ion. Figure 8b shows the integral intensity values, and that of the sample with a reaction time of 24 h is lower than that of the other samples. This can be explained by the fact that NaYF exists in both cubic and hexagonal structures. The formation of NaYFhigh-symmetry crystals leads to a decrease in the radiative recombination of Tm ions; thus, the luminescence of the powder decreases26, 27. When the reaction time was increased to 36 h, the luminescence intensity in the blue, red, and IR regions increased, but the luminescence intensity tended to decrease when the sample was hydrothermally treated for 48 h. This can be explained by the fact that after the hydrothermal treatment time was extended to 36 h, the crystal structure of NaYF was completely hexagonal, so the luminescence intensity increased sharply during this period. However, for the 48 h hydrothermal sample, the crystal structure does not change, so the luminescence intensity is also stable between 36 h and 48 h.
In addition, the CIE 1931 graph (–the inset in Figure 8b) also shows the characteristic blue emission in the visible region of UCMPs with different hydrothermal treatment times. With increasing reaction time, the blue emission tended to shift toward shorter wavelengths and stabilized between 36 h and 48 h. Interestingly, the PL properties of the samples prepared at 180°C for 36 h and at 200°C for 24 h are equivalent. The optimal processing conditions should be considered based on both the reaction temperature and reaction time.

a) PL spectra of NaYF4:1Tm,30Yb, b) the integral intensities as a function of reaction time and CIE 1931
Effect of Yb ion contenton the morphology, structure and optical properties of NaYF :Tm, Yb UCMPs
Figure 9 shows the XRD patterns of the NaYF :1Tm, xYb (with x ranging from 5 to 30 mol%) samples prepared at 180°C for 24 h. For the samples doped with 5 to 25 mol % Yb, all diffraction peaks indicate a hexagonal structure. However, when the Ybcontent was increased to 30 mol%, some diffraction peaks attributed to α–NaYF appeared. This finding implies that a high Yb concentration prevents the phase transition from β–NaYF to α –NaYF. In this case, a reaction temperature higher than 180°C is required to obtain a hexagonal pure structure. In addition, as the Yb concentration increased from 5 mol% to 30 mol%, the crystal size increased from 62 nm to 80 nm (Figure 9b).

a)
The SEM images of the NaYF:1Tm, xYb samples (with x = 20 mol% and 30 mol% Yb) prepared at 180°C for 24 h are shown in Figure 10. The SEM image of the 20 mol% Ybpowder shows only one micrometer rod shape, which is characteristic of the β NaYFcrystal structure(Figure 10a). However, the SEM image of the 30 mol% UCMPs shows some tiny particles beside the micrometer rods (Figure 10b). These particles are related to the -NaYFcrystal structure. This result is completely consistent with the XRD data above.

SEM images of NaYF4:1Tm, xYb synthesized at 180°C for 24 h with a) x= 20 mol% and b) x = 30 mol%.
Figure 11a shows the emission spectra of NaYF:1Tm, xYb with x = 10 mol%, 20 mol%, and 30 mol% Ybunder 980 nm excitation. These samples were synthesized at 180°C for 24 h. The PL spectra of the NaYF:Tm,Yb powders with different Ybconcentrations exhibit characteristic emissions at 470 nm, 650 nm and 800 nm for the Tmions. In particular, an increase in the Ybcontent from 10 mol% to 30 mol% results in an increase in the luminescence intensity in the blue, red and NIR regions. In fact, the higher the Ybconcentration is, the more sensitive the sample is to 980 nm excitation. As a result, more energy is transferred from Yb to Tm for emission. In particular, under 980 nm excitation, the emission in the near-infrared region (798 nm) has a very strong luminescence intensity (Figure 11b).
The CIE 1931 color graph (Figure 11b – inset) was also determined from the luminescence spectra of UCMPs samples with different Yb doping concentrations of 10, 20, and 30 mol%. The results show that the color coordinates of UCMPs in the visible region change insignificantly with increasing Ybdoping concentration. This result shows that the intensity of visible radiation is only slightly affected by the Ybcontent.

a) Emission spectra of NaYF4:1Tm, 30Yb, b) the integral intensities as a function of reaction concentration and CIE 1931 (insert).
Investigation of the surface modification process of UCMPs
In this study, the surfaces of UCMPs were modified by the maleicization process described in our previous study21. Succinic anhydride functional groups on the surface of UCMPs reduce their hydrophobicity and improve their dispersion in polar solvents.
The XRD patterns (Figure 12a) show the structure of the UCMPs before and after being modified with MA (UCMPs@MA). Both samples exhibit the characteristic hexagonal structure of NaYFand the MA modification process does not change the crystal phase of NaYF.
Furthermore, the Raman spectra of the UCMPs and UCMPs@MA shown in Figure 12b only exhibit the characteristic peaks of the hexagonal structure of NaYFat 245 cm, 298 cm, 350 cm, 490 cmand 600 cm28. These findings indicate that the process of modifying UCMPs with MA does not change the crystal structure of UCMPs. On the other hand, the FTIR spectrum of UCMPs@MA exhibited a peak at 1740 cm, which is characteristic of the symmetric valence vibration (C =O) of COOH. The presence of carboxyl groups on the surface of UCMPs contributes to the reduction in hydrophobicity.

a) XRD patterns; b) Raman spectra and c) FT-IR spectra of UCMPs before and after modification with MA.
The prepared printing ink was dropped onto a filter screen on paper and scanned in 3 layers. The product was then dried at room temperature for 2–3 min. The result is illustrated in Figure 13. The logo is invisible under daylight, but the emission is blue under a 980 nm LED (Figure 13).

Screen printing process and logo image under daylight and a 980 nm LED.
DISCUSSION
The findings shown in Figure 3 and Figure 4 and Figure 6 and Figure 7 indicate that the crystal phase and morphology of the NaYF:Tm, Yb UCMPs can be affected mainly by the reaction temperature and reaction time because these synthesis parameters are related to the average kinetic energy of the particles. The arrangement of molecules in UCMPs is strongly correlated with heating temperature. When the temperature and reaction time increase, the crystals of NaYF transform from an α-structure to a -structure. Moreover, an increase in the Yb content from 10 to 30 mol% leads to a significant increase in the emission intensity in the visible and NIR bands, as shown in Figure 11. The high Yb content produces more pumped Yb ions and transfers energy to Tm ions for lighting. However, the NIR luminescence is more intense than the visible luminescence because the emission at 798 nm originates from the transition of electrons between the H and H levels of Tm ions, and the H levels of Tm match well with the F states of Yb sensitizers. Moreover, to emit 474 and 650 nm light, the G and Dlevels of Tm ions are populated, requiring much more energy29, 30. As a result, the energy transfer from Yb ions for NIR emission is more effective than that from other ions.
The grafting of carboxylic functional groups on the surface of the NaYF:Tm, Yb UCMPs through the surface modification process by MA also provides a polar surface. This modification has potential applications in security printing ink and bioimaging.
CONCLUSIONS
The NaYF:Tm, Yb UCMPs were obtained by a hydrothermal method. The structural properties and emission intensities of powders can be determined by changing the reaction conditions, such as temperature and time. The Yb doping concentration (< 30 mol%) has a negligible influence on the crystal phase of the powders. However, an increase in the Ybconcentration causes a remarkable increase in the luminescence intensity in the 450 nm and 798 nm regions, especially in the NIR region. In this work, the optimal conditions for the synthesis of NaYF:Tm, Yb UCMPs with a strong luminescence intensity are a NaF:OA ratio of 1:30 and a reaction temperature of 180°C for 24 h with 30 mol% Yb and 1 mol% Tm. A longer reaction time also enhances the emission intensity of Tm. In addition, UCMPs were also surface modified with MA to improve dispersion in the ink solvent. Printing ink was prepared, and the patterns were printed on paper by silk screen printing. The printed logo is transparent under daylight but readable under 980 nm wavelength excitation.
LIST OF ABBREVIATIONS
Y: Yttrium
Na: Sodium
F: Floride
Tm: Thulium
Yb: Ytterbium
RE: Rare earth
NIR:Near Infrared
FRET: Fluorescence Resonance Energy Transfer
-NaYF 4 and -NaYF 4 Cubic structure and hexagonal structure of NaYF4
UCMPs: Upconversion Microparticles
XRD: X-ray Diffraction
SEM: Scanning Electron Microscope
PLE: Photoluminescence Excitation
PL: Photoluminescence
FT-IR: Fourier Transform Infrared
CIE: International Commission on lllumination
COMPETING INTERESTS
The authors declare no competing interests.
ACKNOWLEDGMENTS
The authors acknowledge the financial support from Vietnam National University Ho Chi Minh City (VNU-HCM) under grant number VL2022-18-05.
AUTHOR'S CONTRIBUTION
Vuong Thanh Tuyen: Synthesizing, Formal analysis, Writing - Original Draft.
Nguyen Ba Tong: Synthesizing and performing the formal analysis.
Le Van Hieu: Review & Editing
Cao Thi My Dung: Review & Editing
Tran Thi Thanh Van Conceptualization, Investigation, Writing - Review & Editing, Supervision.