

Assessing vulnerability to flood hazard of households in Phong Nha town, Bo Trach district, Quang Binh province
- VNU University of Science, Vietnam National University Hanoi
Abstract
This study focuses on assessing the vulnerability of households in Phong Nha town, Bo Trach district, Quang Binh province to flood hazard. A set of 23 indicators for assessing vulnerability to flood was proposed based on three components: exposure, sensitivity, and adaptive capacity. The study area, famous for the Phong Nha-Ke Bang World Heritage Site, has been severely affected by floods. A substantial 81% of households experienced flood damage in 5 recent years in 2019-2023. In particular, the October 2020 flood devastated 85% of households in the town. The study results showed 39% of households have children under five years old and above 65 years old. Regarding adaptive capacity, 56% of interviewed households have basic mitigation tools and only 9.0% actively participate in disaster prevention training course and 4% have property insurance. The values of exposure, sensitivity, and adaptive capacity are 0,67; 0.32; 0.37 in scale 0-1, respectively. The quantitative assessment of the vulnerability of households in Phong Nha town to flood hazard is 0.62 on the scale of -1 and +1, indicating a relatively high level of vulnerability. The results provide a basis for managers to strengthen measures to improve local people's adaptive capacity in preparing for disaster prevention in general and floods in particular.
Introduction
Climate change projections have indicated a significant increase in the frequency and intensity of extreme weather events, such as floods, droughts, and typhoons (Intergovernmental Panel on Climate Change - IPCC, 2022)1. Floods can cause serious impacts on human life and infrastructure in widespread areas. In particular, urban regions are highly vulnerable to floods because of crowded populations and infrastructure density (Chang and Franczyk, 2008)2. The vulnerability assessment of floods is the foundation for supporting the identification of immediate and long-term plans and solutions for proactive disaster reduction activities; thus, flood vulnerability assessment has been a great concern for millions of researchers (Hadipour et al., 2020, Jamshed et al., 2020, Van et al., 2022)3, 4, 5. Abundant research has recently focused on flood vulnerability assessment using indicator-based approaches. Jamshed et al. (2020) assessed how distance to cities influences the vulnerability of communities to flood hazards based on vulnerability indices measured by 325 household surveys4. Hadipour et al. (2020) evaluated the social vulnerability of coastal areas in Banda Abbas, Iran, to sea level rise and flooding using an indicator set of 3 components—exposure, sensitivity, and adaptive capacity—and then used the analytic hierarchy process (AHP) method for weighting indicators3. Van et al. (2022) assessed flood vulnerability using an indicator set for 4 social, economic, environmental, and physical dimensions according to the IPCC method comprising 3 components: exposure, susceptibility, and resilience5.
Vietnam is considered one of the countries most adversely affected by floods. It was estimated that as of 2010, approximately 930,000 people in Vietnam were exposed to flood risk, with total annual losses from flooding of approximately 2.6 billion USD (World Bank, 2018)6. The Quang Binh Province, which is located in central Vietnam, experiences frequent floods each year. In the October 2010 flood event, Quang Binh suffered 74 deaths, 210 injuries, 188,628 flooded facilities, 9,019 ha of submerged and damaged agricultural land, and other widespread damage (Luu et al., 2020)7. According to the United Nations Institute for Training and Research (UNITAR) (2020)8, Quang Binh Province suffered severe flooding in October 2020, with an inundated area of 420 km and approximately 160,000 people affected. Phong Nha town is located in the mountainous area west of Bo Trach district, Quang Binh Province, and is home to Phong Nha Cave in Phong Nha - Ke Bang National Park, which UNESCO recognizes as a World Heritage Site. This severe flooding in October 2020 also affected various social activities, caused landslides, and negatively impacted the community, infrastructure, economic activities, ecosystems, and biodiversity in Phong Nha Town (Phong Nha Town People's Committee, 2019-2023)9.
Flood vulnerability assessment research in Vietnam, particularly in coastal areas, has recently emerged. Luu et al. (2020)7 proposed a flood risk assessment framework for Quang Binh Province based on historical flood data, exposure data, and vulnerability data and revealed total inundation areas of 64,348 ha and 63.3% of the total area at very and extremely high flood risk, respectively. Nguyen et al. (2022) applied an indicator-based approach to evaluate the flood vulnerability index in Hoi An city10. The results show that key factors include the number of organizations involved in disaster prevention and historic site preservation, road density, historical sites, flood frequency, average elevation, and poor households. An et al. (2022) evaluated flood vulnerability at a local scale by a GIS-based approach in Da Nang city using the criteria of 3 components—exposure, sensitivity, and adaptive capacity—and concluded that more than 60% of the region had moderate or high vulnerability to floods11. Nhuan et al. (2016) also proposed 17 indicators for quantifying the adaptive capacity of urban households in Da Nang city. Ha et al. (2023) assessed the flood risk in Quang Binh Province based on socioeconomic vulnerability indicators, including population density, poverty rate, industrial facility density, service and commercial facility density, and road density12. However, research on flood vulnerability at the local scale in Phong Nha town is still limited.
This study conducted a flood vulnerability assessment of households using an indicator-based approach in Phong Nha town in 5 recent years (2019-2023)9. The indicators were measured using survey questionnaires and reports/information from the People's Committee of Phong Nha Town. The findings of this research will fill this critical knowledge gap on the vulnerability of Phong Nha town, providing valuable data and insights for informed decision-making and empowering local authorities to proactively implement effective disaster preparedness and response plans.
Study area
Phong Nha town is located in the Bo Trach district, Quang Binh Province (Figure 1). The study area is 40 km northwest of Dong Hoi city and 30 km northwest of the district center and has a natural area of 9,947.56 hectares, including 3,354 households and a population of 13,104 people, with over 40% of the population being Catholic. There are 09 residential groups, namely, Gia Tinh, Xuan Son, Na, Tram Me, Phong Nha, Ha Loi, Xuan Tien, Cu Lac 1, Cu Lac 2, and 01 Rao Con (generally called Ban Rao Con), with ethnic minorities accounting for 1.5% of the entire town's population (Phong Nha Town People's Committee, 2019-2023)9.

Location of Phong Nha town, Bo Trach district, Quang Binh Province
Methods
Indicator set establishment for flood vulnerability assessment
The flood vulnerability assessment in this study was implemented based on the results of 23 proposed indicators, as shown in
Sociological investigation
The sociological investigation of the study area was conducted with in-depth and semistructured interviews using questionnaires in October 2023 and April 2024. A total of 200 households (20 questionnaires per residential group of the town) were surveyed via semistructured interviews. Additionally, the in-depth investigation was implemented with an environmental officer and five town officials from Phong Nha. This survey aimed to identify and assess factors that contribute to or exacerbate flood exposure, to identify individuals or groups sensitive to floods, to evaluate the adaptability of the local population and to provide input data sources for calculating vulnerability indicators for each residential group and all of Phong Nha town. The interviewed households were evenly distributed across the whole town based on the calculation of sample size using the following equation:
where N is the population of the study area; e is the margin of error of 5.06%; and z is the z score at the sampling confidence level (p) of 85%.
Indicator set for the vulnerability assessment of flood hazards
|
Dimension |
Indicator |
Description |
Normalization |
Code |
Reference |
|
Exposure (E) |
Flood frequency |
Number of floods impacting households in 5 recent years |
Eq. 2 |
E1 |
Kablan et al., 2017 |
|
Distance to the main river |
Distance from households to Son River (km) |
0: >9 km 0.25: 6-9 km 0.5: 3- 6 km 0.75: 1-3 km 1: <1 km |
E2 |
Shi et al., 2019 | |
|
Affected households by flood |
Households impacted by flood in 5 recent years |
0: not affected 1: affected |
E3 |
Pathak et al., 2020 | |
|
Population density |
Number of people per km2 (people/km2) |
Eq. 2 |
E4 |
Bigi et al., 2021 | |
|
Damaged households by flood in October 2020 |
Collapsed houses in floods in October 2020 |
0: not flooded 1/3: flooded below 1 meter 2/3: flooded from 1-3 m 1: flooded over 3 m |
E5 |
Pathak et al., 2020 | |
|
Households lack clean water in floods in October 2020 |
0: no lack of clean water 1: lacking clean water |
E6 | |||
|
Animal deaths from livestock in floods in October 202 |
0: no animal death 0.25: 1-20 animal deaths 0.5: 21- 40 animal deaths 0.75: 41-60 animal deaths 1: > 60 animal deaths |
E7 | |||
|
Sensitivity (S) |
Vulnerable groups |
Children under five years old and those above 65 years old |
0 is not available 1/3: 1 person 2/3: 2 people 1: 3 people or more |
S1 |
Bigi et al., 2021 |
|
Households having a third child |
0: no third child 1: have at least a third child |
S2 |
- | ||
|
Percentage of foreigners (%) |
Calculation % |
S3 |
Bigi et al., 2021 | ||
|
Percentage of females (%) |
Calculation % |
S4 |
Bigi et al., 2021 | ||
|
Livelihood impacts |
Number of households involved in agriculture |
0: no involvement in agriculture 1: involving agriculture |
S5 |
Pathak et al., 2020 | |
|
Income |
Household income lower than the basic income of Vietnamese (Vietnam dongs) |
Eq.2 |
S6 |
Kirby et al., 2019 | |
|
House types |
Households possessing temporary and 1-floor houses |
0: a temporary house 0.5: semipermanent houses 1: house with 2 floors or more |
S7 |
Bigi et al., 2021 | |
|
Adaptive capacity (AC) |
Income source diversity |
Number of livelihood types of households |
0 is 1 livelihood 0.5 is 2 livelihoods 1 is 3 livelihoods |
AC1 |
Nhuan et al., 2016 |
|
Training participation |
Households participating in training courses on disaster |
0: no participation 1/3: participation more than once a year 2/3: participation every 12 months 1: participation less than every 6 months |
AC2 |
Nhuan et al., 2016 | |
|
Preparedness for proactive response |
Number of tools equipped by households (e.g., medicine, water & food storage, flashlight, emergency contact…) |
0: fewer than 3 tools 1: having 3 or more tools |
AC3 |
Bigi et al., 2021 Nhuan et al., 2016 | |
|
Insurance participation |
Households participating in health insurance |
0: no participation 1: participation |
AC4 |
Bigi et al. | |
|
Households participating in property insurance |
0: no participation 1: participation |
AC5 | |||
|
Education level |
People with secondary education or higher |
0: below secondary school level 1: having a secondary degree or higher |
AC6 |
Nhuan et al., 2016 | |
|
Experience |
Number of floods the households witnessed in 5 years |
0: no experience 1/3: witnessed 1-3 floods 2/3: witnessed 4-6 floods 3/3: witnessed over 6 floods |
AC7 |
Bigi et al., 2021 | |
|
Emergency medical access |
Distance from households to the medical area (km) |
0: >15 km 0.25: 10-15 km 0.5: 5- 10 km 0.75: 1-5 km 1: there is a medical area |
AC8 |
Aroca et al., 2017 | |
|
Warning information access |
Households listening to Vietnamese voice radio and television |
0: no radio and television 1: either a radio or a television, or there is both |
AC9 |
Rana et al., 2018 |
Data normalization
The indicators were collected from different sources, such as questionnaires from household surveys and reports from the Phong Nha Town People's Committee in 2019-20239, as indicated in
In this research, all indicators were normalized according to four methods. The detailed normalization results are also shown in
where x is the normalized value of indicator i of household j; Xij is the value of indicator i corresponding to household j; and the max and min values represent each indicator's maximum and minimum values, respectively.
The third method is for indicators coming from questionnaires with households answering yes or no over the total number of households interviewed. In particular, this method was applied for E3, E6, S2, S5, AC3-AC6, and AC9, with values of 1 and 0 corresponding to households' yes or no answers, respectively. The final method is converting to a scale of 0-1 based on the scoring method applied for indicators E2, E5, S1, S7, AC1-AC3, AC7, and AC8.
Assessment of the vulnerability of households to floods
The indicators of each component, E, S, and AC, were calculated for each residential group. The values of the components E, S, and AC of each residential group and the whole of Phong Nha town are the average values of all indicators belonging to each component on a scale of 0-1. The vulnerability of each residential group and the whole town of Phong Nha to flooding were calculated using Eq. 3 as follows (IPCC, 2007)13:
The obtained vulnerability values on scales of -1 and +2 were then converted into the 0-1 scale by applying Eq. 2 with the range for min, max is from -1 to 2. The exposure, sensitivity, adaptive capacity, and vulnerability on a scale of 0-1 were divided into 5 levels, namely, very high, high, medium, low, and very low, corresponding to 0.8-1.0, 0.6-0.8, 0.4-0.6, 0.2-0.4, and 0-0.2, respectively.
Results and discussion
Exposure
In the past 5 years, floods have occurred annually in the study area, and one of the most severe floods recorded was the October 2020 flood. This flood occurred continuously for many days in October, with heavy rainfall. The severity of the damage was recorded and is shown in
Damages from floods in October 2020 in Phong Nha town
|
Damages |
Description |
Quantity |
|
People |
Number of injured people |
12 |
|
Houses |
Number of damaged houses |
6 |
|
Number of flooded houses |
2,610 | |
|
Number of houses need evacuating in emergency |
42 | |
|
Schools |
Number of flooded facilities in schools |
114 |
|
Hospitals |
Number of flooded facilities in hospital |
1 |
|
Culture house |
Number of flooded facilities in culture house |
8 |
|
Agriculture |
Area of flooded plants (ha) |
43.7 |
|
Livestock |
Number of death of animals |
4,369 |
|
Irrigation |
Length of damaged dyke (m) |
1002 |
|
Transportation |
Length of damaged road (m) |
1041 |
|
Fishery |
Area of flooded (ha) |
25.85 |
|
Water |
Number of households lacking clean water to use |
2,536 |
|
Estimated of damages (million dongs) |
20,878.2 | |

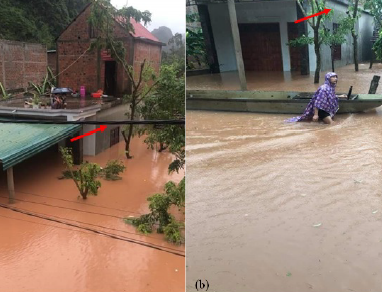
Flood occurrences for the same house in 2020 (a*) and 2022 (b*) and evidence of a flood in the interviewed household in Phong Nha town (c). *Noting that pictures a & b were provided by interview respondents
Figure 3 shows the normalized values of E1, E3-E4, and the average of E5-E7 for each residential group in Phong Nha town. The frequency of floods impacting households in the past five years varies from 0.20 to 0.75. Notably, Tram Me, Ha Loi, Xuan Tien, and Cu Lac 1 experienced the highest flood frequencies, with values of 0.75. The percentage of households impacted by floods in the last five years ranges from 0.40 to 0.99 across residential areas. Na stands out with the highest percentage of affected households at 0.99, followed by Phong Nha and Cu Lac 1. The population density varies significantly among the residential areas, ranging from 0.01 to 0.73. Xuan Son had the highest population density at 0.73, followed by Na and Phong Nha. The proportion of damaged households during floods in October 2020 varied from 0.46 to 0.95 across the 10 residential areas. Most areas experienced extensive damage, with Tram Me and Cu Lac 1 reporting values of 0.90 and 0.84, respectively. Additionally, 8/10 of the residential areas are close to the Son River within 1 km, leading to high values of E2. In contrast, Ban Rao Con had the lowest flood frequency, distance to the Son River, number of affected households, population density, and number of houses damaged by floods in October 2020.

The normalized values of exposure indicators for 10 residential groups

Exposure of Phong Nha town to flood hazard

Submerged level of houses during the October 2020 flood (E5)
The exposure values of E1-E7 for all of Phong Nha town are shown in Figure 4. The flood frequency in 5 recent years is 0.58 (E1). A substantial 78% of households experienced flood damage (E3), indicating high effects of floods within the community. Moreover, with a value of 0.83 for E2, many households reside near the Son River, increasing exposure to flood risks. Although the population density is moderate at 0.51 (E4), it can exacerbate flood impacts, especially in densely populated areas. The flood impact indicators (E5-E7) of the October 2020 flood event provide valuable information on its consequences. During the October 2020 floods, 85% of houses were affected (E5), underscoring the widespread impacts on residential structures. Figure 5 shows the flood levels of houses in Phong Nha town. Approximately 52% and 18% of the residential houses were flooded at depths of 1-3 m and above 3 m, respectively. Additionally, 80% of households faced clean water scarcity (E6) during floods, emphasizing the importance of access to clean water for postdisaster recovery. Additionally, 42% of livestock perished (E7), suggesting economic losses for households reliant on livestock. These findings collectively underscore the multifaceted nature of flood impacts on communities. The average value of the indicators of the exposure component (E) was 0.69, which indicates high exposure to floods.
Sensitivity

The normalized values of the sensitivity indicators for 10 residential groups in Phong Nha town
Figure 6 shows the values of the sensitivity indicators S1-S7 for the 10 residential groups. The vulnerable group indicates the average values of 4 indicators of S1-S4, including children and elderly individuals, households with a third child, foreigners, and females. The results show that the Phong Nha and Xuan Tien residential groups stand out as having the most vulnerable objects. In particular, Phong Nha exhibits a notable value for foreigners (S1, 1.0) and a moderate value for vulnerable age groups (S1, 0.67). Regarding livelihood impacts, family members involved in agriculture (S5) in Tram Me and Na demonstrated the highest values of 0.91-0.92, highlighting a significant reliance on agricultural activities for livelihoods. There was a significant difference in income level among the 10 residential groups. Gia Tinh (S6, 0.44) and Na (S6, 0.41) exhibit a low proportion of households with incomes lower than the basic threshold; otherwise, Ban Rao Con (S6: 0.98) shows the highest value. Additionally, Ban Rao Con exhibits a notable presence of 0.81 single-story houses and wooden houses.
Figure 7 shows the sensitivity values of S1-S7 for Phong Nha town. The study results showed that 76% of households had children under five years old and above 65 years old. In addition, 75% of households had a third child in the family (S2). The study area is one of the travel destinations. Therefore, foreigners unfamiliar with this region's conditions should be considered sensitive. Thirty-nine percent and 50% of the population are foreigners (S3) and females (S4), respectively. When a flood occurs, 77% of family members involved in agriculture are susceptible to rising water levels due to flooding. According to the General Statistics Office of Vietnam (2022)24, the average monthly income per person in urban areas over five years from 2019 to 2023 was 5.7 million people. Thirty-six percent of households had an income lower than this basic value. Fifty-three percent of households lived in temporary and one-floor houses, which are considerably vulnerable to flooding, as shown in Figure 8. Note that 21% and 32% of households lived in temporary and one-floor houses, respectively (S7). Quantitative assessment of the S1-S7 indicators revealed an average sensitivity component (S) value of 0.58, indicating moderate sensitivity.

Sensitivity to flood of Phong Nha town

Housing conditions of the interviewed households (S7)
Adaptive capacity
Figure 9 shows the values of the AC1-AC9 indicators for 10 residential groups in Phong Nha town. The values of almost all of these indicators indicate considerable variation among the 10 residential groups, except for AC5. Specifically, the AC1 (income source diversity) and AC3 (preparedness for proactive response) indicators in these areas vary from 0.12-0.62 and 0.1-0.95, respectively. Most residents in these areas had limited participation in property insurance, so the AC5 values in these areas were equally low. Xuan Tien and Ha Loi demonstrated high adaptive values of income source diversity, preparedness for proactive response, education level, and emergency medical access. Conversely, Ban Rao Con indicated a low adaptive capacity of these criteria.

Values of the AC1-AC9 indicators for 10 residential groups in Phong Nha town
The adaptive capacity to flood all of Phong Nha town is illustrated in Figure 10. Diversity of livelihood was recognized by households possessing more than 2 livelihoods (see Figure 11), resulting in the value of AC1 being 0.42. Eighty-nine percent of households did not participate in annual disaster training courses, which led to an AC2 value of 0.11. The survey revealed that 85% of households participate in health insurance (AC4); however, only 3% have property insurance (AC5). In an emergency, 68% of households were equipped with disaster mitigation tools such as food and water storage, flashlights, medicine, and contact numbers (AC3); however, due to subjective experience in response, some of these households are located far away and at high altitudes, so they are not equipped with natural disaster prevention tools. In addition, the interview results showed that a low percentage of respondents (64%) had a degree higher than a secondary education degree (AC6). It was noted that 86% of residents had good experience with floods (AC7). Up to 79% of households updated their disaster information through television, radio, and network societies (AC9). The average value of the adaptive capacity component was 0.56, indicating medium adaptive capacity.

Adaptive capacity to flood of Phong Nha town

Diversity of livelihoods (AC1)
Vulnerability
The values of exposure (E), sensitivity (S), adaptive capacity (AC), and vulnerability (V) on a scale of 0-1 for the 10 residential groups are summarized in Figure 12. The E values of the residential groups of Gia Tinh, Na, Tram Me, Phong Nha, Ha Loi, and Cu Lac 1 were significantly greater than the AC values. In particular, the AC value was approximately 2 times lower than the E value in the Tram Me residential group. This area also had a medium S value. Therefore, the greatest vulnerability is 0.94 at scales of -1 and +2 according to Eq. 3. After converting to a scale of 0-1, Tram Me obtained a vulnerability value of 0.65, indicating high vulnerability. The opposite trend was observed for the Ban Rao Con residential group, for which the AC value was greater than the S value. Therefore, this region exhibited a moderate vulnerability of 0.56. The Xuan Tien residential group demonstrated the lowest vulnerability at 0.55 because of the equal values of exposure and adaptive capacity.

Values of exposure, sensitivity, adaptive capacity, and vulnerability for 10 residential groups
Figure 13 shows the values of exposure (E), sensitivity (S), and adaptive capacity (AC) of households in the study area to floods in 5 recent years (2019-2023) on a 0-1 scale, which were 0.69, 0.58, and 0.56, respectively. The indicator-based quantitative assessment result indicated that the vulnerability value was 0.57 on a scale of 0-1, revealing a medium vulnerability level. Despite the medium vulnerability of the whole of Phong Nha Town to floods, it is still important to enhance the adaptive capacity of the town in general, especially for some residential groups in the town, especially those with high vulnerability, such as Tram Me and Cu Lac 1.

Vulnerability to floods in Phong Nha town
Discussion and recommendations
The results show that two residential groups, Tram Me and Cu Lac 1, in Phong Nha town exhibited high vulnerability to floods despite the medium vulnerability of the whole town. The findings from in-depth and semistructured interviews reveal that residents have accumulated experience dealing with frequent disasters such as floods. However, in-depth interviews with the vice president of Phong Nha town and officials indicate that this experience is insufficient in response to different and unprecedented flood situations. The households live relatively close to the Son River, resulting in many houses being flooded up to the roof or inundation depths of 3-5 meters. Additionally, the prevalence of Type IV housing and temporary structures within the study area exacerbated the impacts and damage sustained during the flood event. In addition, a lack of preparedness and readiness, such as water storage tanks, backup generators, participation in a training course on disasters, and property insurance of households, were identified as shortcomings of the study area.
The assessment of vulnerability among each residential group in Phong Nha town provides valuable insights for local authorities and organizations, guiding the design and implementation of interventions to reduce vulnerability to future flood events. The importance of enhancing adaptive capacity underscores the need to strengthen resilience and minimize flood vulnerability. To reduce vulnerability within the study area, the following actions are recommended: (1) reinforcing infrastructure and construction measures capable of withstanding disasters, focusing on supporting households with temporary shelters as well as impoverished, vulnerable, veteran, and ethnic minority households; (2) implementing an early warning system to enhance response time to disasters; (3) enhancing community awareness and practices related to disaster prevention; (4) encouraging participation in training courses in disasters and buying property insurance; and (5) providing vocational training to create employment opportunities and increase livelihood diversity for individuals during flood seasons, such as English language training, handicraft workshops, photography, and souvenir making.
Conclusions
This study evaluated the vulnerability of households to flood hazards for each residential group and all of Phong Nha town, Bo Trach district, Quang Binh Province. The three components of exposure (E), sensitivity (S), and adaptive capacity (AC) had average values of 0.69, 0.58, and 0.56, respectively, on a scale of 0-1. The results showed that the household vulnerability was 0.57, indicating medium vulnerability to floods. In addition, the two residential groups Tram Me and Cu Lac 1 exhibited the highest vulnerability indices of 0.65 and 0.61, respectively, indicating high vulnerability to floods. Regarding the adaptive capacity of the whole town, only 11% of respondents actively participated in disaster prevention training, and 3% had property insurance. These findings highlight the need for tailored mitigation strategies to prepare for disaster prevention and enhance resilience in flood-prone communities.
Conflict of interest
The authors declare that there are no conflicts of interest.
Author contributions
This study was designed by the authors Ta Thi Hoai and Nguyen Tai Tue; Vu Thi Hai Yen collected data from field trips and analyzed the data. Authors Ta Thi Hoai, Vu Thi Hai Yen, Nguyen Tai Tue, and Nguyen Thi Hoang Ha participated in writing and revising the manuscript.
Acknowledgments
The authors received no financial support for the research.