

Measurement of cosmic muon angular distribution and deposited energy using sFGD prototype in the T2K upgrade ND280
- VNU-HUS
- 2Institute for Nuclear Science and Technology, Viet Nam Atomic Energy Institute, 179 Hoang Quoc Viet, Cau Giay, Hanoi, Viet Nam
- Faculty of Physics, VNU University of Science, 334 Nguyen Trai – Thanh Xuan – Ha Noi
- Institute of Physics, Vietnam Academy of Science and Technology, 18 Hoang Quoc Viet, Cau Giay, Hanoi, Vietnam
Abstract
The superFGD (sFGD), a scintillator detector, has been chosen as the target for neutrino in the T2K near detector upgrade. Its design enables nearly 4π coverage for neutrino interactions, leading to lower energy thresholds and reduced systematic errors in the experiment. The sFGD is assembled of optically-isolated scintillators measuring 1 × 1 × 1 cm3, it ensures the nessary spatial and energy resolution to minimize uncertainties in future T2K runs. With close to two million cubes assembled into a volumn of 1920 × 560 × 1840 mm3, the sFGD is a significant advencement. A prototypeconsisting of 4×4×3 cubes was studied using cosmic rays. The sFGD prototype, consisting of 48 cubes, was instrumented. We also present the results of the GEANT4 simulation of this prototype. Cosmic ray muon tracks crossing this prototype were simulated by the CRY generator. The results on angular distribution and energy deposition are studied at Tokai (36°27'42.8’N 140°35'57.7’E) and are presented in this paper.
Introduction
T2K (Tokai to Kamioka) is a neutrino experiment conducted in Japan (see Figure 1). The T2K upgrade project was launched in 2017 aiming to investigate CP violation, a phenomenon that breaches the combined conservation laws associated with charge conjugation (C) and parity (P) by the weak force, with a confidence level (CL) of 3σ. A novel concept for a scintillator detector with 3D fine granularity has been introduced as part of this upgrade. This innovative design use 1 x 1 x 1 cm cubes, read out along three orthogonal directions by wavelength-shifting fibers (WLS fibers). This detector serves a a new massive target for neutrino interactions and is named the Super Fine-Grained Detector (sFGD)1.
The commissioning of the sFGD prototype was motivated by the necessity to study the readout electronics, resembling those of the final detector and developing the reconstruction method, along with the analysis methods to identify cosmic rays.

The layout of the T2K experiment.
Muons represent the majority of charged particles in secondary cosmic muon at the ground level. The average energy of cosmic muon reaching the Earth’s surface is around 4 GeV at an approximate rate of 1.1 particle cm/min 2. Cosmic ray muon angle distribution and deposited energy have been extensively studied at sea level3.
The prototype setup was described in Section 2, while Section 3 elaborates on Monte Carlo (MC) simulation utilizing the GEANT4 toolkit and CRY generator. The analysis and reconstruction of data are outlined in Section 4.
Prototype Design and Setup

The block diagram.
The prototype consists of 48 cubes of plastic scintillators, each measuring 4cmx4cmx3cm. These plastic scintillators are composed of polystyrene ((C8H8)n doped with 1.5% of para-terphenyl (PTP) and 0.01% of 1,4-bis benzene (POPOP). Each cube has dimemsions of 1 x 1 x 1cm, with a reflective layer applied to each surface using a chemical agent, resulting in the formation of a 50 – 80 μm thick white polystyrene micropore deposit1, 4. These cubes are assembled in the construction of sFGD in the T2K upgrade. We are utilizing the Y-11(200) MS WLS fiber, manufactured by Kuraray Co, which is the same fiber used in ND280’s current sFGD. It is a multi-clad, round-shaped fiber of S-type (increased flexibility) with a diameter of 1.0 mm. The scintillation light emitted by the cubes is collected by WLS fibers along two orthogonal directions, X and Y (as illustrated in Figure 2), and read out by an MPPC (Multi-pixel Photon Counter) array model S13361-3050AE-04 to detect the position of cosmic rays. The prototype was placed in a black box, as seen in Figure 2 and Figure 3.

The prototype design setup and detector setup.
The prototype area is 16 cm, thus the flux of cosmic ray around I = 16 particles/detector.min. The initial measurement was conducted without a scintillator prototype, to measure the background (dark noise rate). Subsequently, the calibration was performed using a LED with a frequency of 1 kHz, pulse widths of 60 ns and 70 ns. Each measurement was conducted for a duration sufficient to gather a substantial number of counts, aiming to minimize statistical error. Four data sets were recorded with different configurations as listed in
The information of data recording
|
configA |
configB |
configC |
configD | |
|
Parameter |
dWLS-MPPC = 3 mm |
dWLS-MPPC = 1 mm | ||
|
Time recording |
2h |
1h | ||
|
DAC |
680 |
650 |
680 |
650 |
|
Operation Voltage |
55.48 V |
55.66 V |
55.47 V |
55.68V |
|
Event numbers |
2k |
2k |
5k |
5k |
Simulation
The left arm of Figure 4 depicts the simulation process, which was implemented using the Geant4 5, 6, 7 simulation toolkit in conjunction with CRY 8. Geant4, initially developed at CERN, is dedicated to simulating of cosmic muons interacting with the sFGD prototype. Meanwhile, CRY generator (the Cosmic-Ray Shower Library) 8 is an open-source software library developed by the Lawrence Livermore National Laboratory. It is utilized to generate correlated cosmic-ray particle showers for various purposes, including transport or detector simulation code . We utilized CRY to generate muon shower information from cosmic rays at sea level. In this developed code, CRY was coupled to Geant4 to generate the initial primary cosmic rays at the beginning of the simulation process.

The simulation and experimental processes.
The particle percentage in the cosmic ray simulated by CRY
|
Particle |
Contribution (%) |
|
anti_proton |
0.000567216 |
|
e+ |
3.46 |
|
e- |
5.55 |
|
gamma |
52.3 |
|
mu+ |
19.86 |
|
mu- |
18.30 |
|
neutron |
0.097 |
|
pi+ |
0.0035 |
|
pi- |
0.0028 |
|
proton |
0.4384 |
The simulation software of the sFGD prototype used in our work is written and arranged into four major modules. Each part has a distinct task as follow :
-
sFGDproGeo: This module is responsible for constructing simulation geometry within the Geant4 framework. In this paper, the geometry consists of several scintillator cubes relevant to the real prototypes, as displayed in Figure 3.
-
sFGDproPhysics: This module includes all physics processes that delineate the interaction of cosmic rays with the matter contained within a scintillator cube.
-
Output: All interested quantities like energy deposit, interaction location, and angular distribution will be recorded and exported as output.
-
Cry-based Primaries: This module is responsible for generating the primary events of cosmic rays based on the output of Cry.

The the angular distribution of mu- (a), energy distribution of mu- (b), and the acceptance of the cosmic muon passing through the sFGD prototype using the developed software.
The simulation showed that muon, being the main contribution in the cosmic ray, accounted for 38.15% of the events (
Experiment and Analysis Method
The calibration
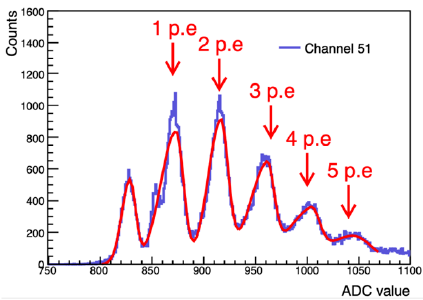
The calibration results were obtained using the fourth LED condition, as show bellow. The raw signal was acquired by illuminating the MPPC array with the LED source (Figure 6a). The raw ADC value was plotted in blue, while the red line presents the multi-Gauss function fitted to the experimental data. The first peak on the left corresponds to the pedestal of the measurement system. The subsequent peaks correspond to 1 pe, 2 pe, 3 pe, and so on. The location of the maximum value of each peak was determined from the fitted curves. Consequently, a value of approximately 41 ADC was found for 1 pe in the fourth case of LED condition (Figure 6b).
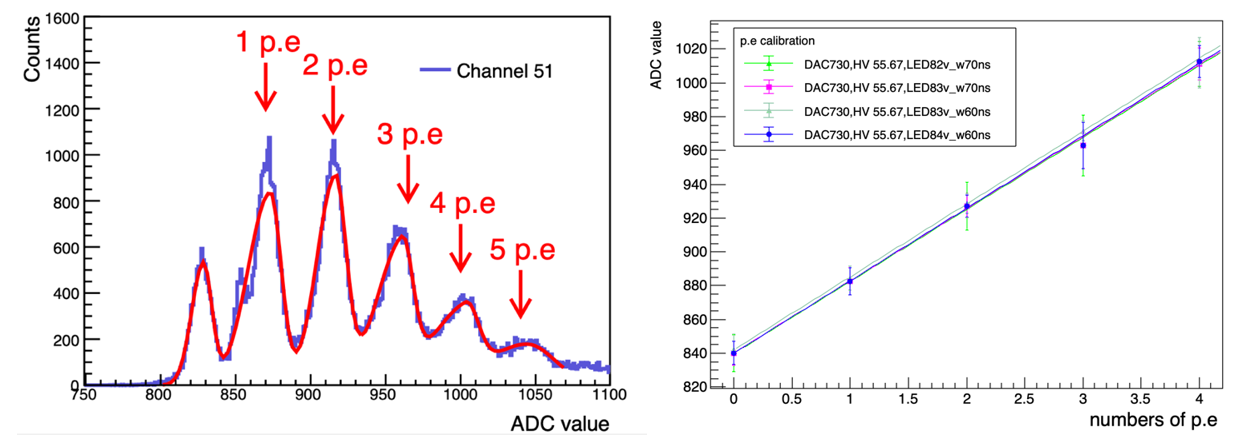
Signal recorded by MPPC array with LED source (a), and calibration curve (b).
The analysis strategy

Raw data of cosmic rays measured with DAC 650, HV5566, 3 mm.
Next, we utilize the prototype to measure the cosmic rays. Figure 7 illustrates the signal of cosmic rays after pedestal subtraction. As shown in Figure 3, each cube contains two WLS fibers along orthogonal directions X, and Y. When a cosmic ray traverses through a cube, the scintillator convert the deposited energy into visible light rays, which are then, partially collected by each WLS fiber. Based on this, we apply the following steps to identify cosmic rays:
-
Pedestal subtraction
-
On each layer, calculate the summation (SUMXY) of all ADC values obtained for both X and Y directions.
-
An event will be considered a cosmic ray if its SUMXY is greater than a given threshold T.

SUMXY of 16 channels without WLS fibers (left) and SUMXY on each layer (right), obtained with configC.
To determine the value of threshold T, we examine the signal of all channels on the layer that contains 16 cubes without WLS fiber. These signals, thus, come from the noise signal. Figure 8 displays the SUM for this case using a configuration of DAC 680, HV 5547, 1mm. It can be seen that most of the values are below 6000. Therefore, we chose T=5800 as a threshold to identify cosmic rays. Figure 9 presents the SUM spectra for signals coming from cosmic rays.
After identifying the cosmic rays, further calculations were performed to estimate the angular distribution and the energy of cosmic rays bombarding the prototype, as shown in the next Section. In particular, the following steps were used:
-
Only events that go through 3 layers are considered.
-
The Centre of Gravity coordinates (xcog, ycog, zcog) are calculated on each layer to determine the impact position of the cosmic ray.
-
In the same event, if the distance between two hit positions is greater than
-
After determining the interaction location in each layer, the track length Lt of a cosmic ray traveling through the prototype is calculated.
-
The incident angle of a cosmic ray is calculated as the angle between Lt and the Zenith axis.

SUMXY spectra obtained by the prototype for different configurations: (a) configA; (b) configB; (c) configC; (d) configD.
-
The final angular distribution is obtained after correcting for the acceptance of the prototype, which is determined by the Geant4 simulation.
-
The deposited energy is determined as
Results and discussion
The angular distribution
Figure 10 presents the comparison between experimental data and the simulation results for the angular distribution of cosmic rays at Earth’s surface. Four measured angular distributions (blue lines) were obtained with different configurations, as listed in

Angular distribution for different configurations: (a) configC; (b) configD.
The deposited energy

Deposited energy of cosmic rays obtained with different configurations: configC.
The deposited energy was determined using the method described in Section 4 as shown in the left figure of Figure 10, while the raw ADC distribution we obtained are displayed in the right figure. Figure 11 shows the initial energy deposited by cosmic rays in the prototype. For all considered configurations, a mean value of deposited energy is determined to be approximately 6.1 MeV
Conclusion
This paper reports the findings concerning the angular distribution and energy deposition of cosmic rays observed in the prototype of the new detector designed for the T2K experiment upgrade. While this issue is not novel, experimental investigations are crucial for comprehending the detector's characteristics. Moreover, reconstructing the characterize of cosmic ray enables the development of methods for reconstructing muon particles in the upgraded sFGD detector for the T2K experiment.
Acknowledgments
None.
Funding
None.
Availability of data and materials
None.
Ethics approval and consent to participate
Not applicable.
Consent for publication
Not applicable.
Competing interests
The authors declare that they have no competing interests.