

Detecting Mental Health Issues in Students Using Limited ECG Data from Portable Devices.
- Ho Chi Minh University of Technology, Vietnam National University Ho Chi Minh City
Abstract
Introduction: Mental health issues are a growing concern among university students, significantly affecting their academic performance and quality of life. Recognizing stress in students under academic pressure is crucial for improving their well-being. This study aims to identify stress patterns through heart activity, which is closely correlated with mental health issues.
Methods: An experiment was designed involving 49 participants during exam time, using low-cost portable devices based on ECG sensors. The high quality of recorded data was confirmed by good average QRS correlation metrics. To enhance the dataset and address the problem of imbalanced data, a Generative Adversarial Network (GAN) was employed to generate synthetic ECG data in two scenarios: GAN 1, which synthesized the minority class only, and GAN 2, which synthesized both classes. A comprehensive set of Heart rate variability (HRV) indices from time, frequency, and non-linear domains were extracted for analysis. Finally, two 2 ensemble learning models were utilized to perform the stress recognition based on the HRV features set.
Results: Through cross-validation and random-split validation, our findings demonstrated significant improvements in model performance with the addition of synthetic data. Specifically, GAN 1 data improved recall, effectively capturing more stress instances, while GAN 2 data enhanced precision, ensuring accurate stress identification. The Random Forest model showed exceptional capability in managing class imbalance, further validating the effectiveness of our approach. Additionally, the use of a natural stressor, such as exam time, confirmed the practical applicability of our models.
Conclusion: These results underscore the potential of dataset enrichment in machine learning, particularly in health-related applications, and provide a robust foundation for future research and real-world validation of synthetic data's benefits in stress recognition tasks.
Introduction
Mental health and well-being are critical issues today, especially for university students, who face considerable pressures and need career development for socioeconomic advancement. Mental health and well-being directly affect the ability to think, learn, handle stress, make decisions, and adapt to the surrounding environment. Research conducted by Vietnam National University, Ho Chi Minh City (VNU-HCM), on the impact of the COVID-19 pandemic on students' mental health provides clear evidence of this. Among the more than 37,150 students surveyed, 56.8% reported experiencing a lack of concentration or interest. These findings indicate that the pandemic has profoundly affected not only the physical health but also the psychological and mental well-being of students 1. Recognizing stress early is crucial, as stress and anxiety significantly impact individuals, which is the primary focus of this research.
An ECG (electrocardiogram) measures and records the voltage changes produced by the electrical activity of the heart during contraction and rest. HRV (heart rate variability) analysis based on ECG data measures the variation in time intervals between consecutive heartbeats 2. This is an important indicator of autonomic nervous system (ANS) function and overall cardiovascular health. HRV is a prominent characteristic of interdependent regulatory systems, which operate on different timescales to help us adapt to environmental and psychological challenges. HRV reflects the balanced regulation of the autonomic nervous system, blood pressure, gas exchange, gut, heart, and vascular tone, referring to the diameter of blood vessels that regulate blood pressure and potentially facial muscles 3. High HRV generally signifies good autonomic flexibility and efficient recovery, whereas low HRV may indicate stress, fatigue, or potential health concerns. However, the HRV varies significantly across individuals and can also be influenced by factors such as age, fitness level, and circadian rhythm. HRV analysis is performed through calculations in time-domain, frequency-domain, and nonlinear methods, depending on the duration of the measurement: typically from 12--24 hours, short-term (5 minutes), and ultrashort-term (<5 minutes)4. Short-term and ultrashort-term analyses play crucial roles in quick daily check-ups, although they face challenges because of the limited data capture time. This study optimizes the characteristics of these domains for short-term HRV analysis applications.
The advancement of data-driven tools, including machine learning and deep learning, has revolutionized biometric data analysis for stress recognition by enabling powerful feature extraction and deep insights through time- and frequency-domain analyses that capture waveform variance and heart activity patterns. For example, Sara et al.5 achieved accuracies of 100%, 97.6%, and 96.2% in classifying stress levels via support vector machine (SVM) models by leveraging features extracted from both the time and frequency domains. On the other hand, deep learning, although lacking an initial hand-crafted feature extraction process, also yields significant performance in stress classification. Through the robust computational capabilities of hidden convolutional layers, deep learning models have been optimized and tailored for ECG data analysis. For example, Deep ECGNet6 optimized the convolution filter length and pooling length specifically to the ECG waveform, achieving an accuracy of 87.39%. However, deep learning models are often considered black boxes, as they do not provide explicit insights into the correlation between specific heart activities and stress.
Capitalizing on informative HRV features, numerous studies have employed machine learning models as data-driven techniques to achieve notable performance in stress recognition tasks. For example, Munla et al. 7 utilized a support vector machine (SVM) model with a radial basis function trained on features from the time, frequency, and nonlinear domains. When deployed during driving operations, this model achieved an accuracy of 83%. In another study, ultrashort-term HRV analysis was performed during a stress recognition test involving mathematical tasks and horror movies as stressors, yielding an accuracy of approximately 90.5% 8. Consequently, HRV has emerged as a powerful technique for ECG data analysis, particularly in the context of stress recognition. Isibor et al. utilized minimum redundancy and maximum relevance (mRMR) to select the most relevant features from a large set of HRV indices across time, frequency, and nonlinear domains 9. Their results showed remarkable performance when sets of 10 and 15 features were used for stress recognition applications. Furthermore, Mariam et al. reported high performance in stress recognition via time-domain features 10. However, the limited amount of data remains a significant challenge for model development. Additionally, the context of stressors in the field differs significantly from those typically used in laboratory settings. In this study, we designed an experiment to collect and analyze real-world data.
Limited data are a critical challenge for data analysis, particularly in field data. Several studies have employed data augmentation techniques to enhance data insights. For example, ECG data can be augmented through basic transformations in the time domain. Garett et al. 11 proposed time inversion, resulting in a 5% improvement in model accuracy. Naoki et al. 12 introduced RandECG, augmenting ECG data by adding random noise, which improved accuracy by up to 3.51%. Advanced techniques, such as the use of generative adversarial networks (GANs), have shown promising performance in producing diverse and realistic synthetic ECG data13. Han Sun et al. 14 proposed a GAN-based ECG abnormal signal generator, achieving an 11% improvement in accuracy with high-quality synthetic data. Building on these approaches, we propose a data augmentation pipeline and a GAN architecture to improve the limited dataset collected from the field.
In this study, our objectives are as follows:
-
Field ECG data collection was implemented to facilitate stress recognition. The experiment focuses on university students experiencing the natural stressor of final exams at the end of the semester.
-
Extracting a wide range of HRV indices from time, frequency, and nonlinear domains facilitates comprehensive and detailed analysis.
-
ECG data generation is performed via a generative adversarial network to enrich the current limited-amount dataset.
-
Using ensemble learning models to perform stress recognition tasks on the basis of a set of HRV indices, the efficacy of these models in identifying stress patterns accurately can be assessed.
Materials & methods
ECG Data Gathering
Participants
For the purposes of this investigation, data collection was undertaken at the Ho Chi Minh City University of Technology, involving a cohort of 49 students (Figure 1). These participants presented with an average age of 21.31 years (SD = 1.108). The sex distribution within this group included 32 males (65.31%) and 17 females (34.69%), as detailed in
This study aims to examine the stress levels experienced by students during critical periods of the academic semester. Specifically, the research focuses on the latter half of the semester, a time characterized by heightened stress due to impending exams and academic evaluations. In other words, this investigation identifies the natural stressors associated with the approach of testing periods as a significant factor contributing to the overall stress experienced by students during these times.
Demographic information of the participants
|
Variables |
Groups |
Quantities |
|
Total number of students participating in the experiment: 49 Age range: 18 - 24 | ||
|
Gender |
Male |
32 (65.31%) |
|
Female |
17 (34.69%) | |
|
Year |
First-year students |
1 (2.04%) |
|
Second-year students |
9 (18.37%) | |
|
Third-year students |
18 (36.73%) | |
|
Fourth-year students over |
21 (42.86%) | |

Participants by gender (A) and year of study (B)
To evaluate the mental health status of the participants, the Vietnamese adaptation of the Patient Health Questionnaire-9 (PHQ-9) was administered, facilitating the assessment of depression levels15. The specifics of the questionnaire, including the PHQ-9 items for the two administered surveys (detailed in Appendix 1). This survey outlines the scoring categories used to interpret the PHQ-9 results: nonminimal, mild, moderate, moderately severe, and severe. For the purpose of this research, scores categorized as nonminimal and mild are interpreted as indicative of a nondepressive state, whereas scores falling within the moderate, moderately severe, and severe ranges are considered reflective of a depressive state.
ECG data recording procedure
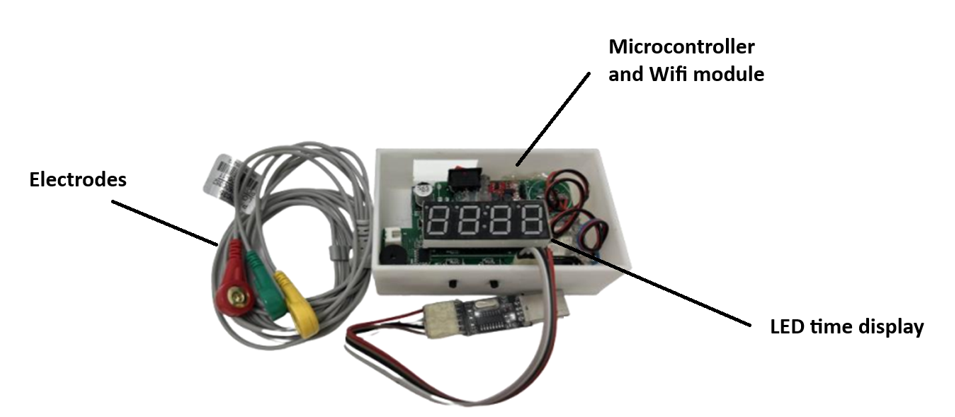
In this study, we aim to utilize low-cost portable ECG systems for data gathering and analysis. The ECG device was developed using an electrocardiogram sensor (DFRobot SEN0213) and an STM32F103C6 microcontroller, with data transfer facilitated by a WiFi module (ESP8266) and powered by a lithium battery with an integrated charging module. The device uses electrodes that adhere to the patient's skin to acquire ECG signals. All the components are integrated into a cohesive unit for ECG signal acquisition (see Figure 2). Upon initiation, the device begins a 15-minute countdown, corresponding to the duration of each volunteer's activity for the measurements.
The integrity of the recorded data was evaluated postcollection via the average QRS technique16. This approach assesses the consistency of ECG data recordings by analyzing the congruence between each QRS complex and the average QRS complex present within the dataset, effectively quantifying the average correlation coefficient of the QRS complexes. This metric was employed to ascertain the quality of the data collected by the newly developed portable ECG device.

Developed ECG device.
As described, each participant underwent a 15-minute data recording procedure. Initially, volunteers completed a PHQ-9 survey to assess their mental health status. The volunteers subsequently engaged in a focused test session lasting 15 minutes, which was conducted under white light illumination (Figure 3). A lead-1 ECG with 3 electrodes was implemented in the experiment. To standardize participant activity, a simple concentration test was administered throughout the experiment, aimed at generalizing recording conditions and minimizing variations among participants. The test primarily involved tasks related to counting and pattern identification (see sample in Appendix 2). The entire testing process, including instructions and predata gathering surveys, was completed within a 20-minute timeframe. The data were recorded via a measuring device at a sampling rate of 100 Hz.

Volunteers perform tests during the data gathering experiment
Data Preprocessing and Rpeak Detection
In this study, preprocessing steps were performed to alleviate baseline wandering and noise in the ECG signal. This involved employing a high-pass Butterworth filter with a cutoff frequency of 0.5 Hz and a fifth order. The application of this filter effectively reduces the presence of noisy low-frequency components, thereby enhancing the clarity of the underlying cardiac activity in the ECG waveform. Consequently, this facilitates the QRS detection process and enhances the subsequent analysis and interpretation. Additionally, to combat noise stemming from electrical sources, powerline filtering at a frequency of 50 Hz was also implemented.
Before HRV features were extracted, the RR interval signal was obtained through the QRS complex and R-peak detection methods. Initially, QRS complexes were identified on the basis of the steepness of the absolute gradient of the ECG signal 17. Subsequently, R-peaks were identified as the local maxima within each QRS complex. The accurate detection of R peaks is crucial, as they represent ventricular depolarization, indicating the transition of the ventricles from the anode state to the cathode state. Precise R-peak detection is fundamental for ensuring the reliability of subsequent analysis procedures.
ECG Data Synthesis
The proposed pipeline, which uses a generative adversarial model to enrich the real dataset, is illustrated in Figure 4. Synthetic data were generated by the GAN model and combined with real data in three different scenarios (Section 2.2b). After the HRV indices were extracted, two ensemble learning models were employed to perform stress classification (Sections 2.3 and 2.4).

The proposed pipeline

Generator (A) and discriminator (B) developed in this work.
Generative adversarial network model
A dedicated synthesis model was developed on the basis of the recording duration (see Figure 5). This model is a one-dimensional convolutional neural network inspired by previous work18. The generative model aims to generate a 15-minute ECG record from random noise. The initial noise from the input layer is flattened and reshaped. Subsequently, three deconvolutional layers, along with leaky ReLU activation functions and batch normalization, are utilized to upsample the signal gradually. Finally, a 15-minute ECG recording is obtained.
To improve the quality of the synthesized data, a discriminative model with a strong ability to distinguish between real and fake data is needed. The inception model was employed to extract features from the ECG sequence effectively. The feature map was then concatenated and fed to a global average pooling layer, which calculates the feature map average, unlike the traditional flattening method. Finally, a dense layer combines the information and provides the results.

Waveforms of synthesis data (A) and original data (B)
Data Generation
To generate the dataset from various states, the categorized stress and nonstress data were generated separately. The amount of synthesized data was determined in three scenarios:
-
Without the GAN, only real data were used, with 39 nonstress and 10 stress subjects.
-
GAN 1: Data are generated for the minority class (stress) only to ensure that the number of minority classes is equal to that of the majority class. A total of 29 ECG recordings categorized as stress were generated.
-
GAN 2: The amount of synthesized data was equal for both stress states, and the total amount of synthesis data was equal to the real data (25 stress and 24 nonstress individuals).
HRV feature extraction
For short-term heart rate variability (HRV) analysis, a 5-minute window length was used to segment the recorded data. A comprehensive set of HRV features was subsequently extracted via the Neurokit DE2 module tool 19. A total of 90 features were derived from three domains, namely, the time domain, frequency domain, and nonlinear analysis, facilitating thorough analysis (refer to Appendix 3).
Classification Model
Machine Learning Model
In this study, two ensemble learning models were employed for an
-
The first model utilized was random forest (RF), a bagging model constructed from multiple decision trees for classification tasks. Each decision tree in the ensemble operates independently, employing different sets of features to reduce the correlation among them. Ultimately, the ensemble makes decisions through voting, with the class receiving the most votes becoming the final prediction of the random forest model.
-
The second model employed was XGB (eXtreme Gradient Boosting), a boosting ensemble learning algorithm comprising several learners. In this method, each new learner is trained to rectify the errors made by its predecessors, thereby progressively improving the overall performance. To prevent overfitting, regularization terms such as Lasso and Ridge are incorporated into the learning process. This ensures that the model generalizes well to unseen data beyond the training set.
Finally, the grid-search algorithm was implemented to optimize the parameters of each model.
Evaluation
To assess the stress recognition ability of the HRV-based models and the impact of an enriched dataset, cross-validation and random split validation were performed. Specifically, 4-fold cross-validation was conducted to evaluate the classification performance and generalizability across the three scenarios. For random-split validation, 30% of the real data were used as test data, whereas the remaining 70% served as the training set. This approach was used to confirm whether the synthetic data improve the classification accuracy and stimulate real-world application. To quantitatively assess the performance of the classification models, metrics such as accuracy and the weighted average F1 score were utilized. These measures provide insights into the overall effectiveness of the models in classifying mental health issues.
Results
Data Quality Assessment
The quality of the recorded ECG data is notably high, which is attributed to a robust quality index. The average QRS correlation is 0.92 (SD=0.09), which is comparable to findings in prior studies on ECG data quality assessment. For example, in the work of Daluwatte20, a similar average QRS correlation of approximately 0.93 was observed. Moreover, the cleaned data showed a greater correlation across the QRS complex and fewer noise spikes, as illustrated in Figure 4.

Raw (A) and cleaned (B) ECG data
Classification Results
In the 4-fold cross-validation results, the enriched dataset presents a significant improvement in the stress recognition task (see
Cross-validation results of 3 scenarios on 2 machine learning models.
|
Scenario |
Model |
Accuracy |
Weighted F1-score |
|
Real data |
Random Forest |
0.78 |
0.44 |
|
XGB |
0.78 |
0.34 | |
|
GAN 1 |
Random Forest |
0.90 |
0.84 |
|
XGB |
0.84 |
0.79 | |
|
GAN 2 |
Random Forest |
0.86 |
0.84 |
|
XGB |
0.78 |
0.81 |
In the random-split validation, the combination of real and synthetic data shows considerable classification performance. The models trained on real data achieved an accuracy and weighted F1 score of 0.90, indicating a high level of overall performance. The precision and recall for the stress class were both 0.75, demonstrating a balanced ability to correctly identify both positive and negative instances of stress. This suggests that the model is effective in recognizing stress when trained on real data, providing a strong baseline for comparison. In the first scenario of data synthesis (GAN 1), the model's accuracy and weighted F1 score decreased to 0.80, and the precision for the stress class decreased to 0.70. However, the recall improved to 0.88. This finding indicates that while the model trained on the GAN 1 data is less precise in identifying stress instances, it is better at capturing most of the stress cases (higher recall). For the GAN 2 scenario, the model's accuracy and weighted F1 score returned to 0.90, similar to the real data scenario. The precision for the stress class significantly improved to 1.00, indicating perfect precision—every instance identified as stress was truly a stress instance. However, the recall decreased to 0.75, meaning that the model's ability to identify all stress instances was similar to that of the real data scenario.
Random-split validation results of 3 scenarios on the random forest model.
|
Scenario |
Accuracy |
Weighted F1-score |
Precision on stress class |
Recall on stress class |
|
Real data |
0.90 |
0.90 |
0.75 |
0.75 |
|
GAN 1 |
0.80 |
0.80 |
0.70 |
0.88 |
|
GAN 2 |
0.90 |
0.90 |
1.00 |
0.75 |
In summary, the results from both cross-validation and random-split validation indicate that the use of GAN-generated data can enhance model performance, particularly for the random forest model. The GAN 1 data improve the recall, whereas the GAN 2 data significantly increase the precision, demonstrating the potential of synthetic data to address different aspects of model performance in stress recognition tasks.

Confusion matrix of 3 scenarios: real data (A), GAN1 (B), and GAN2 (C)
Discussion
This work has demonstrated the robust capability of HRV analysis on ECG data for stress recognition in real-world applications. The high accuracy observed in the real data scenario across both the cross-validation and random-split validation pipelines, particularly when testing on real ECG data, underscores the strong correlation between HRV indices and stress. Furthermore, our study utilized a natural stressor, exam time, which enhances the practical applicability of machine learning models. From a model performance perspective, the random forest classifier not only provided comparable classification results but also exhibited superior handling of class imbalance, as evidenced by its higher weighted F1 score. However, further work could be performed at various times in a semester.
Enriching the ECG dataset via generative adversarial networks (GANs) can significantly improve stress classification performance, particularly in scenarios with limited data. The results demonstrate enhanced evaluation metrics for the stress class. For example, in cross-validation, the weighted F1-scores for the two GAN scenarios outperformed those obtained using only real data. This improvement indicates a better balance in recognizing both stress and nonstress instances, particularly benefiting the minority class (the stress class). Moreover, the developed GAN model generated high-quality synthetic data. Adding these good synthetic data leads to better generalization and representation, which in turn enhances the learning efficiency of machine learning models, especially ensemble learning methods. Additionally, the class imbalance issue is mitigated, reducing bias in the decision-making process. In conclusion, the use of GAN-generated data not only improves the performance metrics but also ensures a more balanced and effective classification of stress, demonstrating the potential of GANs in enriching datasets for more robust machine learning applications.
Our work also provides insights into how synthetic data can enhance conventional datasets. We conducted two scenarios with different synthetic data utilization strategies: one scenario synthesizing the minority class only (GAN 1) and another synthesizing both classes (GAN 2). In the cross-validation setting, the GAN 1 scenario demonstrated sustainable performance, outperforming the real data scenario because of improved class balancing. The accuracy of GAN 1 was slightly higher than that of GAN 2 when the input amount of each class was balanced. In the random-split validation, which involved only real data as the test data, the GAN 2 scenario provided better accuracy, a weighted F1 score, and precision in the stress class. Conversely, the GAN 1 scenario yielded better recall in the stress class (Figure 8). The results indicate that while the model trained on the GAN 1 data is less precise in identifying stress instances, it is better at capturing most of the stress cases (higher recall). This trade-off suggests that GAN 1 data introduce variability that helps the model to generalize better, albeit at the cost of precision (Figure 8). In contrast, the GAN 2 data aid in making very precise stress identifications but do not improve the model's sensitivity to detecting all stress instances. These findings highlight the potential of synthetic data to enhance conventional datasets. The choice between GAN 1 and GAN 2 depends on the specific needs of the application. For applications requiring high recall, the GAN 1 approach is more suitable. For those requiring high precision, the GAN 2 approach is preferable. Overall, our study illustrates the effectiveness of using synthetic data to improve model performance in stress recognition tasks.
Conclusion
This work involved field ECG data collection and the design of a framework for stress recognition on the basis of HRV analysis of a limited ECG dataset. This study highlights the potential of using GAN-generated synthetic data to enhance HRV-based stress recognition models. By comparing models trained on real data with those augmented by synthetic data in two scenarios—GAN 1 (synthesizing the minority class only) and GAN 2 (synthesizing both classes)—we observed significant performance improvements. The GAN 1 data improved the recall to 0.88, whereas the GAN 2 data improved the precision to 1.00, demonstrating the ability of synthetic data to balance class distributions and enhance model generalizability. The use of a natural stressor, such as exam time, confirmed the practical applicability of our models. The random forest model, in particular, showed superior performance in handling class imbalance, with the highest cross-validation accuracy of 0.90 and a weighted F1 score of 0.84. These findings underscore the importance of dataset enrichment in machine learning, especially in health-related fields. The use of synthetic data can improve model robustness and accuracy, offering a valuable tool for future research and applications. This study provides a strong foundation for further exploration and real-world validation of the benefits of synthetic data in stress recognition tasks.
LIST OF ABBREVIATIONS
ANS: autonomic nervous system
ECG: electrocardiogram
GAN: generative adversarial network
HRV: Heart rate variability
PHQ-9: Patient Health Questionnaire-9
RF: random forest
ReLU: rectified linear unit
SD: Standard deviation
SVM: Support Vector Machine
XGBoost: eXtreme gradient boosting
COMPETING INTERESTS
The author(s) declare that they have no competing interests.
ACKNOWLEDGEMENTS
This research is funded by Ho Chi Minh City University of Technology (HCMUT), VNU-HCM, under grant T-KHUD-2023-06. We acknowledge Ho Chi Minh City University of Technology (HCMUT), VNU-HCM, for supporting this study.
Appendix
Appendix 1. PHQ-9 rating scale
|
PHQ-9 Score |
Depression Severity |
Comment |
|
0 – 4 |
None-minimal |
Observation, treatment may not be needed |
|
5 – 9 |
Mild |
Watchful waiting; repeat PHQ-9 at follow-up |
|
10 – 14 |
Moderate |
Treatment plan, considering counseling, follow-up, and/or pharmacotherapy |
|
15 – 19 |
Moderately Severe |
Active treatment with pharmacotherapy and/or psychotherapy |
|
20 – 27 |
Severe |
Immediate initiation of pharmacotherapy and, if severe impairment or poor response to therapy, expedited referral to a mental health specialist for psychotherapy and/or collaborative management |
APPENDIX 2. PHQ-9 survey questionnaire (Vietnamese Version)
|
Không |
Trong vài ngày |
Hơn 1 tuần |
Hầu hết tất cả các ngày | |
|
1. Tôi ít khi hứng thú với công việc của mình |
0 |
1 |
2 |
3 |
|
2. Tôi cảm thấy u uất, phiền muộn hoặc vô vọng |
0 |
1 |
2 |
3 |
|
3. Tôi khó ngủ hoặc thường xuyên tỉnh dậy trong đêm, hoặc tôi ngủ quá nhiều |
0 |
1 |
2 |
3 |
|
4. Tôi thấy mệt mỏi hoặc không có năng lượng |
0 |
1 |
2 |
3 |
|
5. Tôi không thèm ăn hoặc ăn quá nhiều |
0 |
1 |
2 |
3 |
|
6. Tôi nghĩ rằng tôi là người xấu xí hoặc thất bại, hoặc tôi cảm thấy vì tôi mà gia đình tôi không vui vẻ gì |
0 |
1 |
2 |
3 |
|
7. Tôi không thể tập trung đọc báo hoặc xem tivi |
0 |
1 |
2 |
3 |
|
8. Tôi đi hoặc nói rất chậm đến nổi mà người khác có thể thấy, hoặc tôi đang lang thang hay đi đi lại lại nhiều vì tôi cảm thấy lo lắng và bồn chồn |
0 |
1 |
2 |
3 |
|
9. Tôi nghĩ tôi sẽ tốt hơn khi chết đi hoặc tự ngược đãi bản thân |
0 |
1 |
2 |
3 |
|
Điểm |
…/27 | |||
APPENDIX 3. Features extracted from the HRV dataset used in the study.
|
Parameter |
Description | ||
|
HRV time-domain indices |
HTI |
The integral of the density of the RR interval histogram divided by its height. | |
|
IQRNN |
The interquartile range of the RR intervals. | ||
|
MadNN |
The median absolute deviation of the RR intervals. | ||
|
MaxNN |
The maximum of the RR intervals. | ||
|
MCVNN |
The median absolute deviation of the RR intervals (MadNN) is divided by the median of the RR intervals. | ||
|
MeanNN |
The mean of the RR intervals. | ||
|
MedianNN |
The median of the RR intervals. | ||
|
MinNN |
The minimum of the RR intervals. | ||
|
pNN20 |
Percentage of successive RR intervals that differ by more than 20 ms. | ||
|
pNN50 |
Percentage of successive RR intervals that differ by more than 50 ms. | ||
|
Prc20NN |
The 20th percentile of the RR intervals. | ||
|
Prc80NN |
The 80th percentile of the RR intervals. | ||
|
RMSSD |
Root mean square of successive RR interval differences. | ||
|
SDANN |
The standard deviation of the average NN intervals for each 5-minute segment of a 24-hour HRV recording. | ||
|
SDNN |
The standard deviation of NN interval. | ||
|
SDNNI |
Mean of the standard deviations of all the NN intervals for each 5 min segment of a 24-hour HRV recording. | ||
|
SDSD |
The standard deviation of the successive differences between RR intervals. | ||
|
TINN |
Baseline width of the RR interval histogram. | ||
|
HRV frequency-domain indices |
ULF |
The absolute power of the ultralow-frequency band (≤0.003 Hz). | |
|
HF |
Absolute power of the high-frequency band (0.15-0.4 Hz). | ||
|
HFn |
Relative power of the high-frequency band (0.15-0.4 Hz) in normal units. | ||
|
LF |
Absolute power of the low-frequency band (0.04-0.15 Hz). | ||
|
LF/HF |
The ratio of LF-to-HF power. | ||
|
LFn |
Relative power of the low-frequency band (0.04-0.15 Hz) in normal units. | ||
|
LnHF |
The log-transformed HF. | ||
|
VLF |
The absolute power of the very-low-frequency band (0.0033-0.04 Hz). | ||
|
HRV nonlinear domain indices |
Poincaré Plot |
SD1 |
The standard deviation of the PP is perpendicular to the line of identity. |
|
SD2 |
The standard deviation of the PP along to the line of identity. | ||
|
SD1SD2 |
The ratio of SD1 to SD2. | ||
|
Area of ellipse described by SD1 and SD2 (pi*SD1*SD2). | |||
|
Entropy |
ApEn |
Approximate entropy. | |
|
FuzzyEn |
Fuzzy entropy. | ||
|
SampEn |
Sample Entropy. | ||
|
SE |
Shannon Entropy. | ||
|
Fractal Dimensions |
DFA |
Estimation of signal fluctuations using detrended fluctuation analysis. | |
|
CD |
Estimation of a minimum number of variables to define a dynamic model. | ||