

Surface features of graft-type polymer electrolyte membranes using tapping mode atomic force microscopy analysis
- Faculty of Materials Science and Technology, University of Science, Ho Chi Minh City, Vietnam
Abstract
Introduction: Polymer electrolyte membrane fuel cell (PEMFC) is a promising renewable energy technology, which is increasing commercial use in transportation, stationaries, and portable devices. In the PEMFC, the surface nature of PEMs plays a key role in interfacial degradation of membrane-electrolyte assembly and proton conductance and thus, highly impacting on the performance and stability of PEMFC. Consequently, the objective of this work is to investigate the surface features of graft-type poly(styrenesulfonic acid) (PSSA)-grafted poly(ethylene-co-tetrafluoroethylene) polymer electrolyte membranes (ETFE-PEMs) using tapping mode atomic force microscopy (TM-AFM). Methods: The ETFE-PEMs are prepared using the pre-irradiation-induced grafting of styrene onto the ETFE film and subsequent sulfonation. All the ETFE-PEMs and their precursor films (original ETFE and polystyrene (PS) grafted-ETFE films) are characterized by the TM-AFM. Results: Upon the grafting and sulfonation process, partially grafted PS and PSSA chains are found to be accumulated on the sample surface at a low grafting degree (GD) of 21% and more graft chains are diffused into the bulk of membranes at higher GDs of 36 and 57%. The polystyrene grafts are immiscible mostly with the amorphous phase of the pristine ETFE film, leading to the formation of new amorphous phase containing of only PS grafts. The sulfonation resulted in the microphase separation between the backbone of ETFE and side chain of PSSA but the final surface morphology of membranes can be determined at the grafting step. Conclusions: The surface morphology characteristics are more or less ascertained at the grafting process but not the sulfonation one. The PSSA grafts of ETFE-PEMs are dispersed on the membrane surface, favoring for the connection of ionic domains, leading to the increase in proton conductance on the membrane surface. It is suggested that the ETFE-PEMs exhibit the advantages in the membrane-electrode interfacial properties for PEMFC application due to its low accumulated surface in the low GD.
INTRODUCTION
The polymer electrolyte membrane fuel cell (PEMFC) has attracted much attention for applications in transportation, stationary, and portable devices because of its high energy efficiency (40–60%) and lack of gas emission. This application is expected to address pollutant emissions and thus reduce the impact of climate change 1. The polymer electrolyte membrane (or proton exchange membrane) (PEM) is the key component of a PEMFC because its ionic conductivity, mechanical strength, and thermal and chemical stability are significantly related to the performance and durability of the cell. Perfluorosulfonic acid membranes such as Nafion are the state-of-the-art advanced materials for PEMs, but their limitations, such as high production cost and low performance at high temperature and low relative humidity (RH), have triggered investigations of alternative polymer electrolyte membranes to replace Nafion1. In our previous works2, 3, 4, 5, 6, 7, 8, 9, 10, 11, 12, 13, 14, 15, 16, 17, 18, we reported the synthesis and characterization of poly(styrenesulfonic acid)-grafted poly(ethylene-co-tetrafluoroethylene) polymer electrolyte membranes (ETFE-PEMs) within a wide range of grafting degrees (GDs) of 0–125%, corresponding to an ion exchange capacity (IEC) of 0–3.3 mmol/g via gamma-ray irradiation-induced grafting of styrene onto an ETFE film (grafted-ETFE) and subsequent sulfonation of the grafted film. Compared with other fully or partially fluorinated graft-type PEMs19, 20, 21 or Nafion membranes9, 10, 15, 16, ETFE-PEMs exhibit higher or comparable proton conductivities, mechanical integrity and thermal stability. In particular, ETFE-PEMs with high IECs (> 2.7 mmol/g) show greater conductivity at 30% RH and competitive tensile strength at 100% RH and 80 °C than the commercial Nafion-212 membrane 15.
Recently, membrane–electrode assembly (MEA) failures have been observed after only a few hundred PEM operations and have been found to be closely related to the nature of the membrane surface22, 23. The inferior interfacial properties of MEAs have been recognized to be associated with backbone and functional chain degradation and crack development. For example, concentrated PSSA grafts on the surface of poly(styrene sulfonic acid) (PSSA)-grafted poly(tetrafluoroethylene-coperfluorovinyl ether) polymer electrolyte membranes (PFA-PEMs) and PSSA-grafted poly(tetrafluoroethylene) polymer electrolyte membranes (PTFE-PEMs) were observed to decompose within 50 h in fuel cells running24, 25, 26. Moreover, the low or high functional graft distribution on the membrane surface resulted in low conductance and surface fractures, respectively27, 28. However, there are still limitations in the detailed and systematic evaluation of the surface features of ETFE-PEMs2, 5, although these limitations are quite important for their performance in PEMFCs.
Tapping mode atomic force microscopy (TM-AFM) is a potential method for investigating the surface morphology of membranes because it allows us to observe high-resolution topographic images and avoid any surface dragging effects of tips on surface sampling29. In TM-AFM analysis, common parameters such as surface roughness (S), root-mean-square roughness (S), and maximum spike-to-valley height roughness (S(P-V)) are often used to describe the surface architecture in the vertical dimension. Since these parameters do not show any information in the horizontal direction, the additional shape parameter of skewness (S) is chosen to provide missing information in the horizontal direction. This combination provides a comprehensive understanding of the surface architecture of membranes. The aim of this work was to investigate the change in the surface morphology of ETFE-PEMs through the preparation procedure and with the degree of grafting via AFM analysis. As the structural features of the final polymer electrolyte membrane (ETFE-PEM) are highly dependent on those of the pristine polymer and grafted polymer films, TM-AFM measurements of the pristine ETFE and grafted-ETFE films were also conducted.
EXPERIMENTAL
Materials
Commercial 50-μm-thick ETFE films (or Tefzel films) were purchased from AGC Ltd., Japan. Furthermore, other chemical substances (i.e., styrene, 1,2-dichloroethane, hydrogen peroxide, acetone, toluene, and chlorosulfonic acid) were obtained from Wako Pure Chemical Industries, Ltd., Japan. In this work, all the chemical substances were used as received (i.e., without further treatment).
Preparation of graft-type ETFE-PEMs
The general procedures for the preparation and chemical structures of ETFE, grafted-ETFE, and ETFE-PEM are depicted in Scheme 1. The preparations were similar to those comprehensively described in our previous works 11, 15. Accordingly, the present study is briefly outlined as follows. The ETFE films were irradiated by g-rays emitted from a Co source under and an argon atmosphere. The energies of the gamma rays are approximately 1.17 and 1.33 MeV. These energies are high enough for the occurrence of photoelectric, Compton, and pair production effects within the irradiated ETFE films at the same time. These effects can generate a large number of secondary electrons, which in turn induce many sequential physical interactions (coastal interactions) to create free radicals. The absorbed dose and dose rate were 15 kGy and 15 kGy/h, respectively. This irradiation dose is expected to generate free radicals but does not modify the microstructures within the irradiated films4. These free radicals serve as active sites for the grafting process. The irradiated films were then immersed in a styrene/toluene mixture at different concentrations and different time courses at 60 C for graft polymerization to obtain polystyrene-grafted ETFE films. During the grafting process, the PS chains are expected to diffuse through the amorphous phase until the grafting occurs mostly at the crystalline–amorphous interfaces (where the free radicals can last much longer than those in the amorphous regions, where the free radicals vanish rapidly). The degree of grafting (GD) is determined via the following formula: GD (%) = 100*(W - W)/W, where W and W are the masses of the sample before and after the grafting step, respectively. The grafted films were soaked in a 0.2 M chlorosulfonic acid solution in 1,2-dichloroethane at 50 C (approximately 6 hours) for sulfonation to obtain the graft-type ETFE-PEMs11, 15. Note that the chemical structures of the grafted ETLs and ETFE-PEMs were confirmed by Fourier transform infrared (FT-IR) spectroscopy11 and X-ray photoelectron spectroscopy (XPS) analysis5. Specifically, new bands appeared at 1492 and 1600 cm (skeletal in-plane deformation of the conjugated C=C of the benzene ring), and new bands emerged at 756 and 698 cm (CH out-of-plane vibration), indicating that styrene was grafted onto the ETFE film. Moreover, new bands at 840 and 607 cm (stretching vibration of S=O) appear after sulfonation, which suggests that the grafted-ETFE was sulfonated successfully to create the ETFE-PEM. XPS analysis revealed a significant decrease in the fluorine content, which mainly resulted from graft incorporation and the defluorination reaction during the grafting process. In addition, an additional peak at 169.1 eV was observed, indicating the existence of sulfonic acid groups (SO) within the ETFE-PEM.

Preparation procedure and structures of graft-type ETFE-PEMs. The samples were prepared via preirradiation-induced grafting of styrene onto the ETFE substrate to obtain the grafted-ETFE and subsequent sulfonation to obtain the ETFE-PEM. Owing to the high energy of gamma rays, the whole volume of the ETFE film is expected to be irradiated at the same time. The generated radicals within the amorphous phase vanish quickly, whereas those within the crystallites or crystallite surfaces can last for a long time. Thus, the grafting is assumed to be at the amorphous–crystalline interface
AFM measurement
The AFM analyses of the original ETFE, grafted-ETFE films, and ETFE-PEMs were carried out with a SPA-400 instrument (Seiko Instruments, Japan) in tapping mode under ambient conditions. The microscope was equipped with a calibrated 20-μm-xy-scan range and a 10-μm-z-scan range of the PZT scanner. All measurements were conducted at room temperature using an aluminum-coated silicon tip (SI-DF40) on a cantilever with a spring constant and resonance frequencies of 31 N/m and 320 Hz, respectively. Surface scanning was performed at a scan rate of 1 Hz. The end radius of the silicon probe was approximately 10 nm. The distance from the probe to the sample was 100 nm. Before the measurement, the samples were cut into small pieces of 1 × 1 cm fixed to the mica substrate with adhesive tape, and then mounted onto the sample holder. In this study, all the images were analyzed via Gwyddion software (version 2.49) to determine the specific roughness parameters (i.e., S, S, S(P-V), and S) of the surface morphology. These values were determined directly via integrated routines from the height scan. S describes the mean height of asperities (i.e., average surface roughness), whereas S represents the standard deviation of a height profile from its average height (root mean squared surface roughness)30, 31. Both the S and S parameters describe the vertical dimensions quite well but provide no insight into the horizontal dimensions of the surface architecture. S(P-V)) and S, which represent the distance from the highest to the lowest points and the irregularities on the surface, are also used to evaluate the overall roughness and asymmetry of the topography. Accordingly, the S(P-V)) and S parameters are more descriptive in horizontal dimensions. The line profile was generated by selecting one line from the corresponding two-dimensional image and subsequently plotting x-translation versus height data (z-axis). Each profile was plotted by using an appropriate height scale to provide optimum resolution. These parameters are calculated through the following expressions32:
where L is the sampling length, z is the height value of point i, and is the average height within the scanning area. The height distribution, r(z), is also plotted as the normalized probability of finding a particular height z with the origin at the lowest observed z–height33. The distribution of surface height ρ(z) is described in the following form:
RESULTS
The surface features through the preparation procedure
Figure 2 (a-i) and

Surface features obtained through the preparation procedure at a scan size of 2000 nm. 3D (a-c) and 2D (d-f) AFM images and line profiles (g-i) of the original ETFEs,grafted-ETFEs, and ETFE-PEMs with a GD of 21%. The surface roughness profiles of the grafted-ETFE and ETFE-PEM films are more homogeneous than those of the original ETFE film.
Specific roughness parameters (
|
Sample |
GD (%) |
Sa (nm) |
Sq (nm) |
Sz(P-V) (nm) |
Skew |
|
Original ETFE |
0 |
15.5 |
19.6 |
104.9 |
0.6 |
|
Grafted-ETFE |
21 |
8.0 |
10.0 |
72.2 |
0.3 |
|
ETFE-PEM |
21 |
10.1 |
12.6 |
81.0 |
0.1 |
Surface features with various degrees of grafting
Grafted ETLEs
Figure 3 shows 3D AFM images of grafted-ETFE films with different GDs ranging from 0–57%. As the degree of grafting increases, the formation of small graft domains containing polystyrene (PS) chains increases but at a lower rate. The S values at GDs of 21, 36, and 57% are 15.5, 8.0, 5.9, and 8.2 nm, respectively. With similar grafting degrees, the values of S (10.0, 7.6, and 10.1 nm), S(P-V) (72.2, 71.8, 73.6) and S (0.3, 0.6, and 0.5) are obtained. Clearly, all surface parameters of the grafted-ETFE films are lower than those of the pristine ETFE film, as shown in

3D surface images of the grafted-ETFE films with GDs of 0-57% at a scan size of 2000 nm. The bright yellow regions correspond to the softer domains of the amorphous regions of the pristine ETFE and/or PS grafts. Note that the image of the original ETFE is represented again for comparison.
Specific roughness parameters (
|
Sample |
GD (%) |
Sa (nm) |
Sq (nm) |
Sz(P-V) (nm) |
Skew |
|
Original ETFE |
0 |
15.5 |
19.6 |
104.9 |
0.6 |
|
Grafted-ETFE |
21 |
8.0 |
10.0 |
72.2 |
0.3 |
|
Grafted-ETFE |
36 |
5.9 |
7.6 |
71.8 |
0.6 |
|
Grafted-ETFE |
57 |
8.2 |
10.1 |
73.6 |
0.5 |
ETFE-PEMs
Figure 4 and

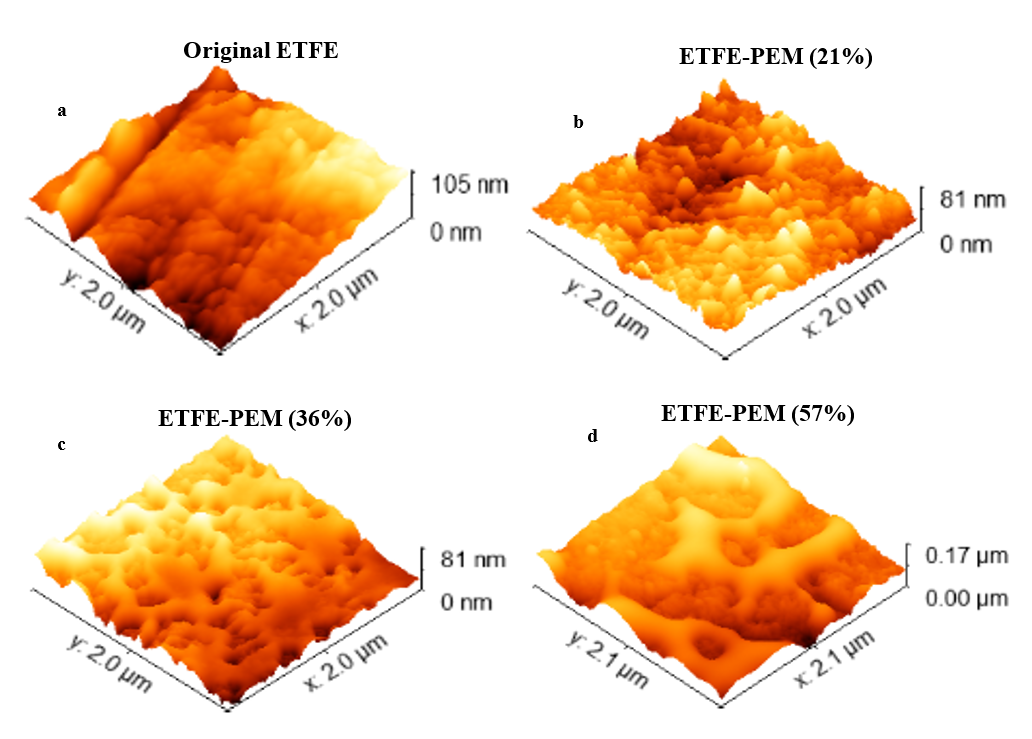
3D surface images of the ETFE-PEMs with GDs of 0-57% at a scan size of 2000 nm. The connections among ionic domains on the membrane surface increase with the degree of grafting. In this case, the 3D image of the pristine film is also represented again for comparison.
Specific surface parameters (
|
Sample |
GD (%) |
Sa (nm) |
Sq (nm) |
Sz(P-V) (nm) |
Skew |
|
Original ETFE |
0 |
15.5 |
19.6 |
104.9 |
0.6 |
|
ETFE-PEM |
21 |
10.1 |
12.6 |
81.0 |
0.1 |
|
ETFE-PEM |
36 |
14.2 |
16.4 |
81.4 |
0.2 |
|
ETFE-PEM |
57 |
23.3 |
28.3 |
169.1 |
0.2 |
Figure 5 depicts the height distributions of the original ETFE, grafted-ETFE, and ETFE-PEM with GDs of 21-57% at a scan size of 2000 nm. The height distribution of the original ETFE is displayed by a red line, whereas those of the grafted-ETFE films and ETFE-PEMs are represented by cyan and green lines. The height distribution of the pristine film can be fitted by two Gaussian peaks with average heights of 40.1 and 72.8 nm and FWHMs of 35.7 and 9.4 nm. In contrast, the height distributions of the grafted-ETFE films at GDs of 21, 36, and 57% can be fitted by only one Gaussian peak with average heights of 24.9, 22.5, and 22.4 nm and FWHMs of 21.4, 16.4, and 16.3 nm, respectively. As expected, the z values of the grafted-ETFE films are lower than those of the original ETFE film, i.e., similar to the case of S indicated in

The height distribution of the samples at a scan size of 2000 nm. The original ETFE (1 – red line), grafted-ETFE (2 – cyan line), and ETFE-PEM (3 – green line) have GDs of 21–57%.
Specific surface parameters (z and FWHM) of the original ETFE, grafted-ETFE, and ETFE-PEMs with GDs ranging from 21--57%. The z values of the grafted-ETFE films slightly decrease with GD, whereas those of the ETFE-PEMs increase with GD.
|
Sample |
GD (%) |
z (nm) |
FWHM (nm) |
R2 |
|
Original ETFE (peak 1) |
0 |
40.1 |
35.7 |
0.932 |
|
Original ETFE (peak 2) |
0 |
72.8 |
9.4 |
0.932 |
|
Grafted-ETFE |
21 |
24.9 |
24.1 |
0.983 |
|
Grafted-ETFE |
36 |
22.5 |
16.4 |
0.987 |
|
Grafted-ETFE |
57 |
22.4 |
16.3 |
0.857 |
|
ETFE-PEM |
21 |
38.9 |
30.4 |
0.985 |
|
ETFE-PEM (peak 1) |
36 |
30.1 |
18.7 |
0.942 |
|
ETFE-PEM (peak 2) |
36 |
56.7 |
21.8 |
0.942 |
|
ETFE-PEM (peak 1) |
57 |
70.5 |
41.0 |
0.927 |
|
ETFE-PEM (peak 2) |
57 |
108.7 |
27.8 |
0.927 |
DISCUSSIONS
The results presented in Figure 2 and
The results of the height distribution shown in Figure 5 and
CONCLUSIONS
The surface features of the ETFE-PEMs obtained through the preparation procedure and with different degrees of grafting were investigated via TM-AFM analysis. Partially grafted PS and PSSA chains accumulated on the sample surface at a low GD of 21% and then diffused partially into the bulk of the membranes at higher GDs of 36 and 57%. All the surface parameters of the grafted-ETFE films did not clearly change with GD, whereas those of the ETFE-PEMs increased with GD. In particular, the PS grafts of the grafted-ETFE films are mostly immiscible within the ETFE-based matrix and can be described as having a single distribution (i.e., homogeneous distribution). In contrast, the PSSA grafts of ETFE-PEMs are dispersed on the membrane surface, favoring the connection of ionic domains and leading to larger continuous ionic domains. The dispersed distribution of PSSA grafts can accelerate proton conductance on the membrane surface, while the low accumulation of grafts on the membrane surface at a low GD is advantageous for improving the membrane‒electrode interfacial properties of PEMFCs.
LIST OF ABBREVIATIONS
AFM: Atomic force microscopy
ETFE: Ethylene-co-tetrafluoroethylene
ETFE-PEM: Poly(styrenesulfonic acid)-grafted poly(ethylene-co-tetrafluoroethylene) polymer electrolyte membrane
FWHM: Full width at half maximum
GD: Grafting degree
Grafted-ETFE: Polystyrene-grafted ethylene-co-tetrafluoroethylene
IEC: Ion exchange capacity
PEMCF: Polymer electrolyte membrane fuel cell
PS: Polystyrene
PSSA: Poly(styrenesulfonic acid)
RH: Relative humidity
TM-AFM: tapping mode atomic force microscopy
COMPETING INTERESTS
There are no conflicts of interest to declare.
ACKNOWLEDGMENTS
This work was funded by the Vingroup Big Data Institute (VINBIGDATA), Vingroup and supported by the Vingroup Innovation Foundation (VINIF) under project code VINIF.2020.DA08.
DATA AVAILABILITY STATEMENT
The data sets are not publicly available but are available from the corresponding author upon reasonable request.
AUTHORS CONTRIBUTION
Tran Duy Tap: Conceptualization, project administration, funding acquisition, supervision, resources, investigation, methodology, data curation, formal analysis, supervision, validation, visualization, writing - original draft, writing - review & editing. Nguyen Nhat Kim Ngan: Investigation, methodology, data curation, formal analysis, validation, visualization, writing - original draft, writing - review & editing. Nguyen Manh Tuan, Nguyen Huynh My Tue, Vo Thi Kim Yen, Dinh Tran Trong Hieu, Hoang Anh Tuan, Tran Ngoc Tien Phat, Lam Hoang Hao, Nguyen Thanh Ta, Doan Thi Kim Ngan: Investigation, Formal analysis, Visualization, Validation.